Dashboard#
Overview Dashboard#
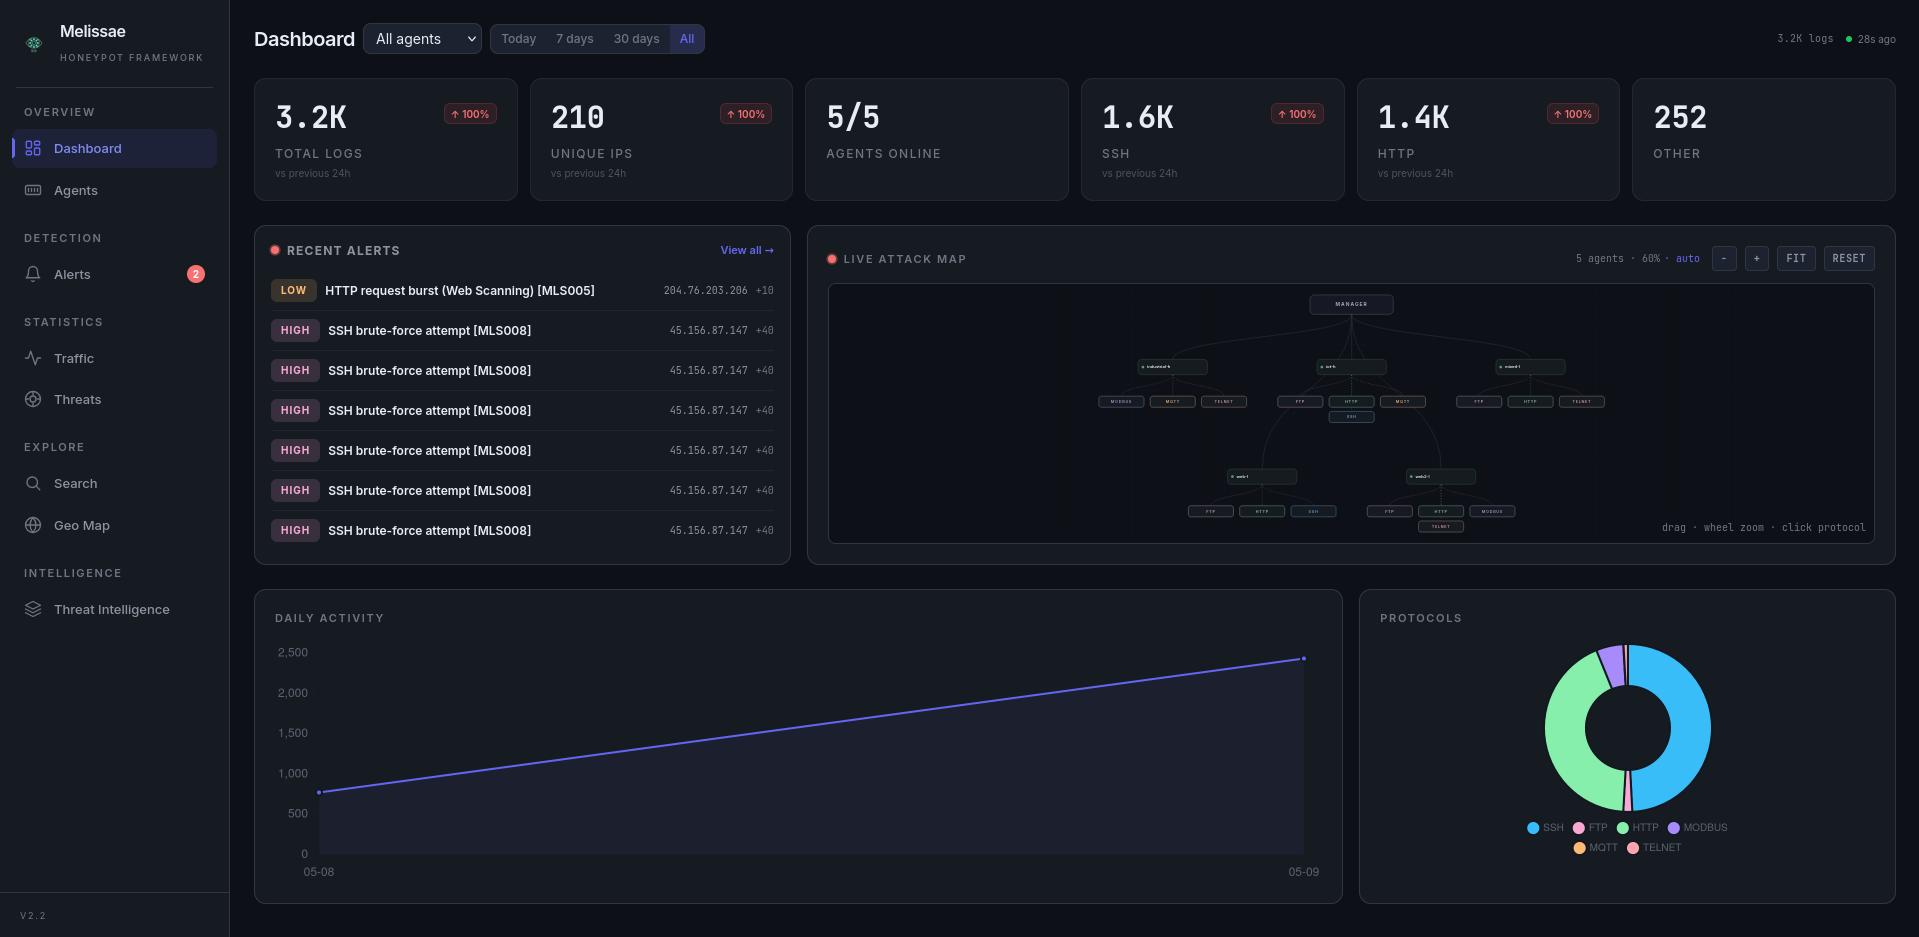
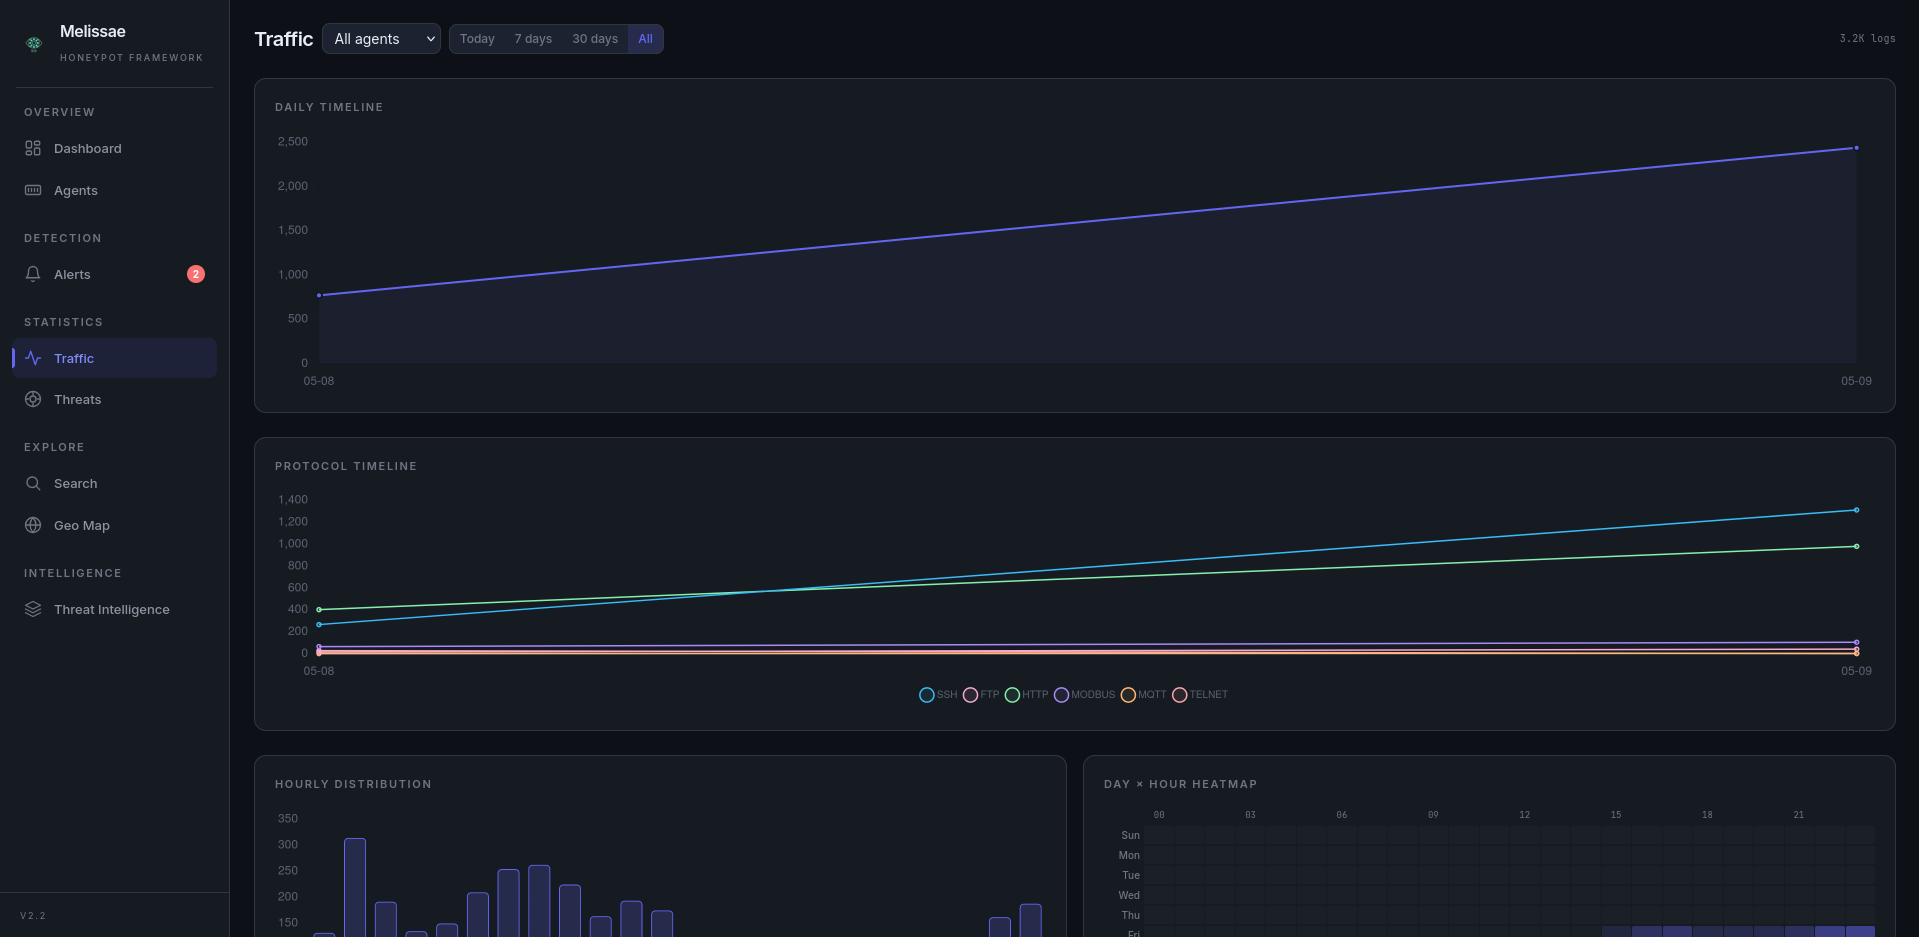
The main view provides a comprehensive real-time overview:
Stat Cards with trend arrows — Total events, unique IPs, malicious verdicts, per-protocol breakdowns. Each card shows a percentage change vs the previous 24h (↑/↓ indicators).
Date Range Filter — Toggle between Today, 7 days, 30 days, or All to scope the dashboard.
Auto-Refresh — Dashboard data refreshes every 30 seconds with a live “Xs ago” indicator.
Multi-Day Timeline — Line chart showing daily event volume over the selected range.
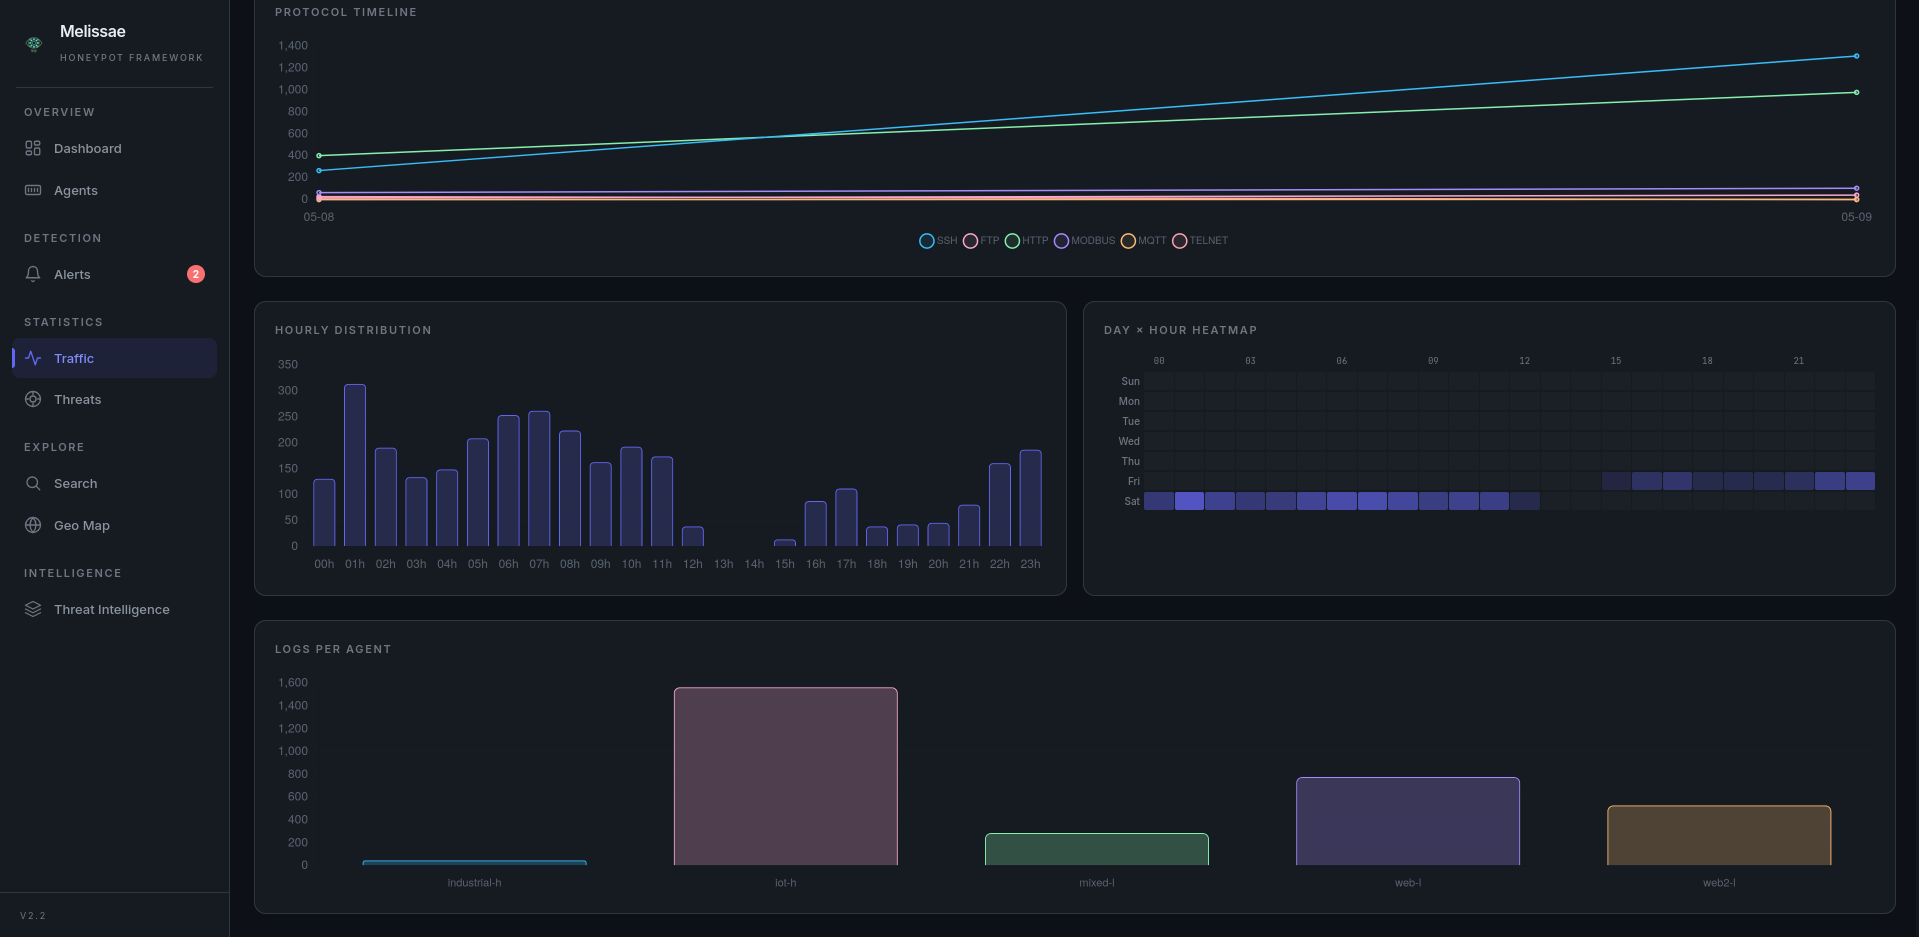
Activity Heatmap — Day-of-week × hour-of-day grid with color intensity, revealing peak attack windows.
Activity Bar Chart — Hourly event distribution.
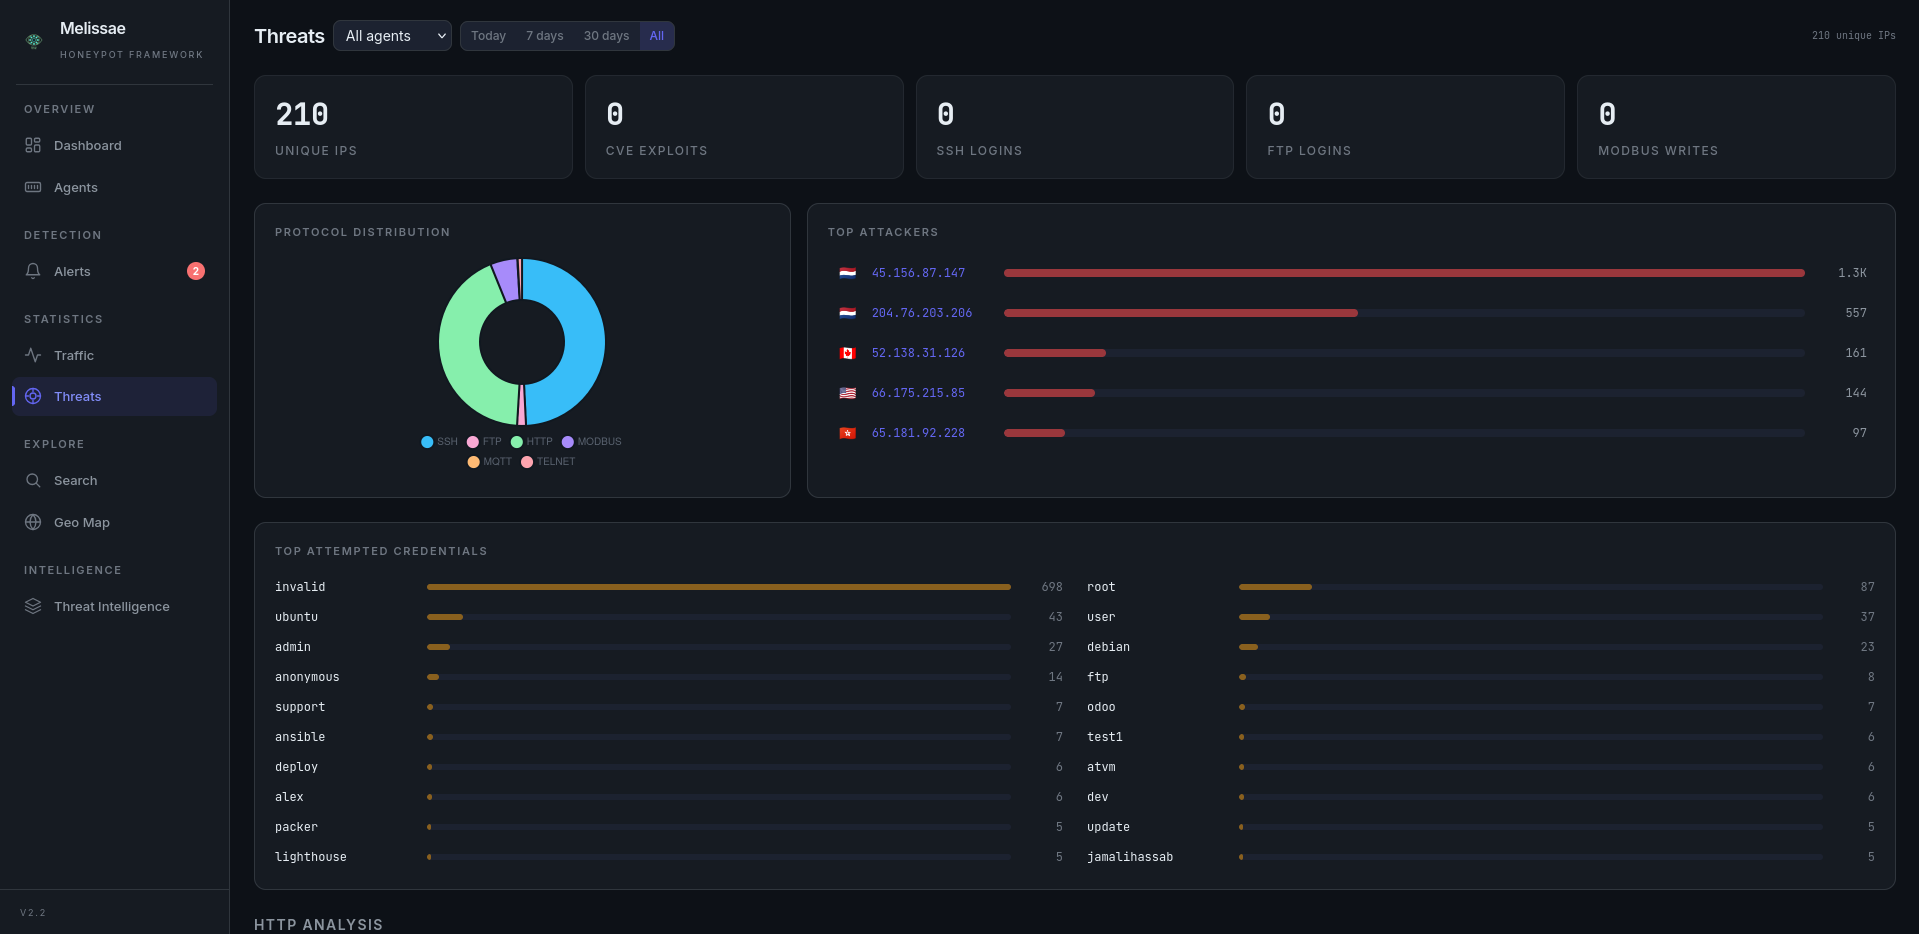
Protocol Doughnut — Visual breakdown of traffic by protocol.
Agent Bar Chart — Event volume per agent.
Top Attackers List — Top attacking IPs with country flags (via GeoIP enrichment).
Top Credentials — Top 10 attempted usernames across SSH/FTP/Telnet with hit counts.
Critical Events Section: When security-critical events are detected (CVE exploits, successful logins on Telnet/SSH/FTP, Modbus write attempts), a highlighted alert section appears at the top of the dashboard with red-themed cards showing event counts.
Agents Page#
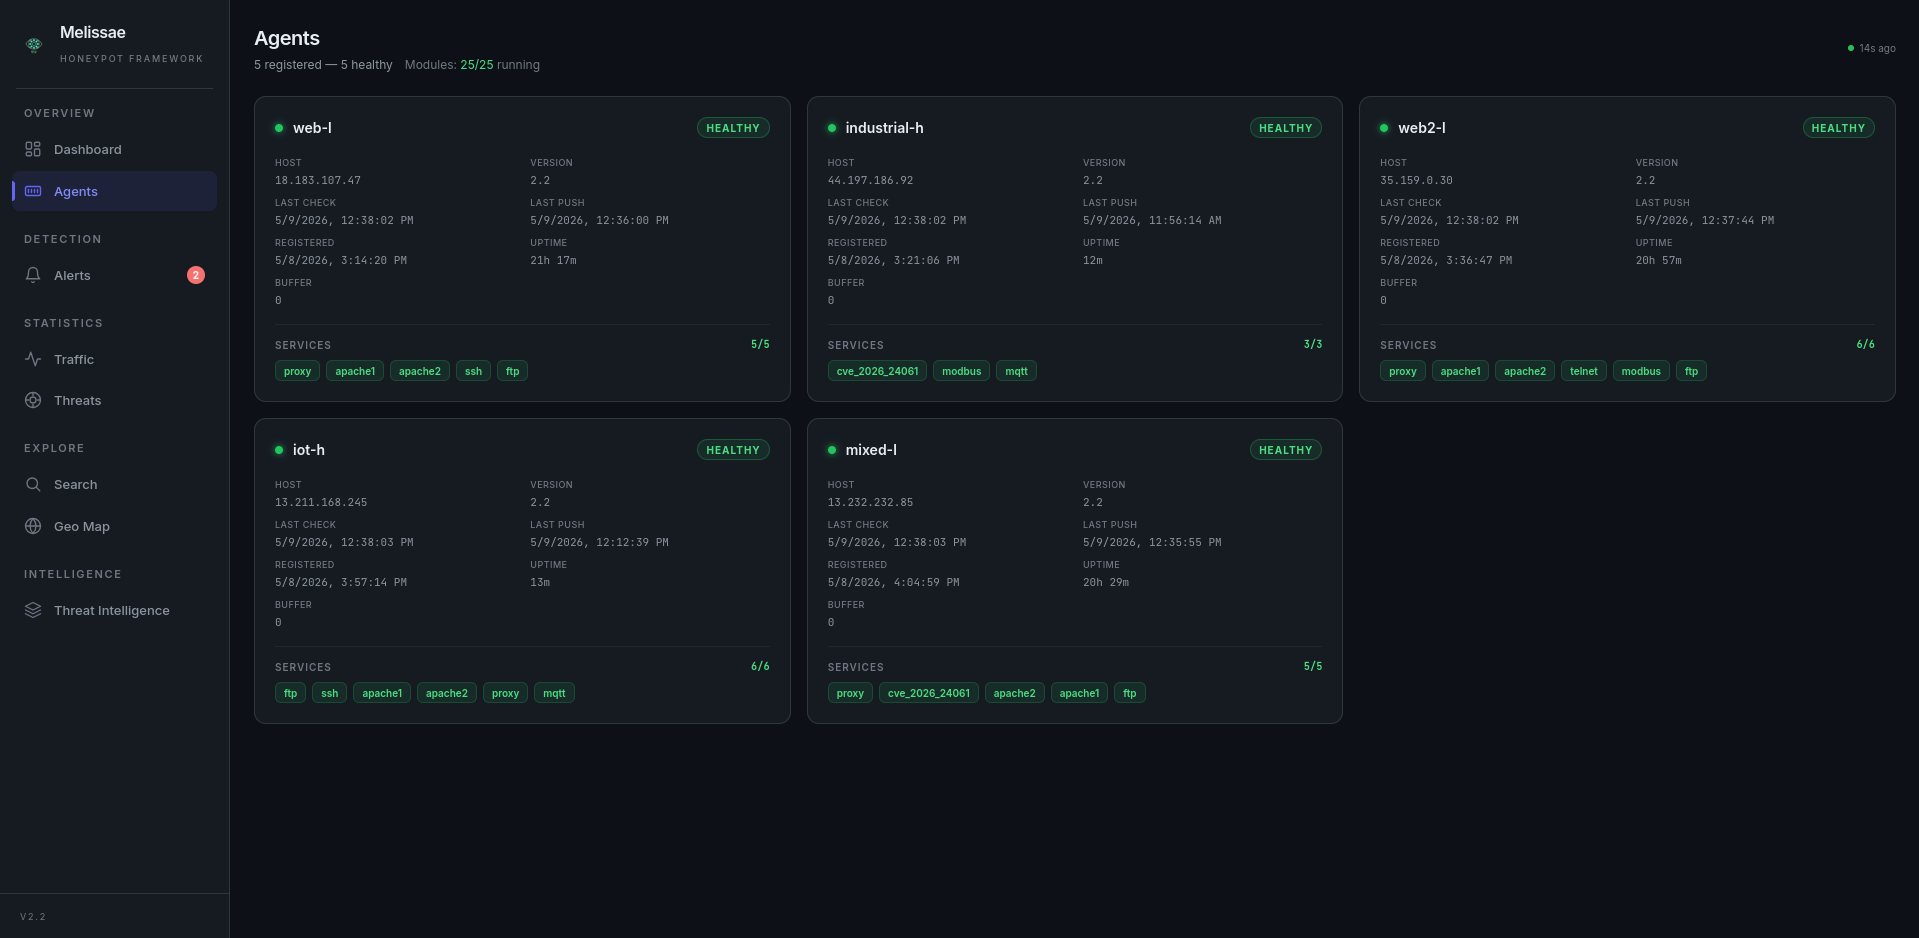
The /agents page provides real-time visibility into the agent fleet (auto-refreshes every 15s):
Status indicator (healthy / degraded / unreachable / pending) with color coding
Host address, last push time, last health check
Active modules per agent with running/stopped state, aggregate running/total count
Buffer pending count and uptime
Live refresh indicator with “Xs ago” counter
GeoIP Attack Map#
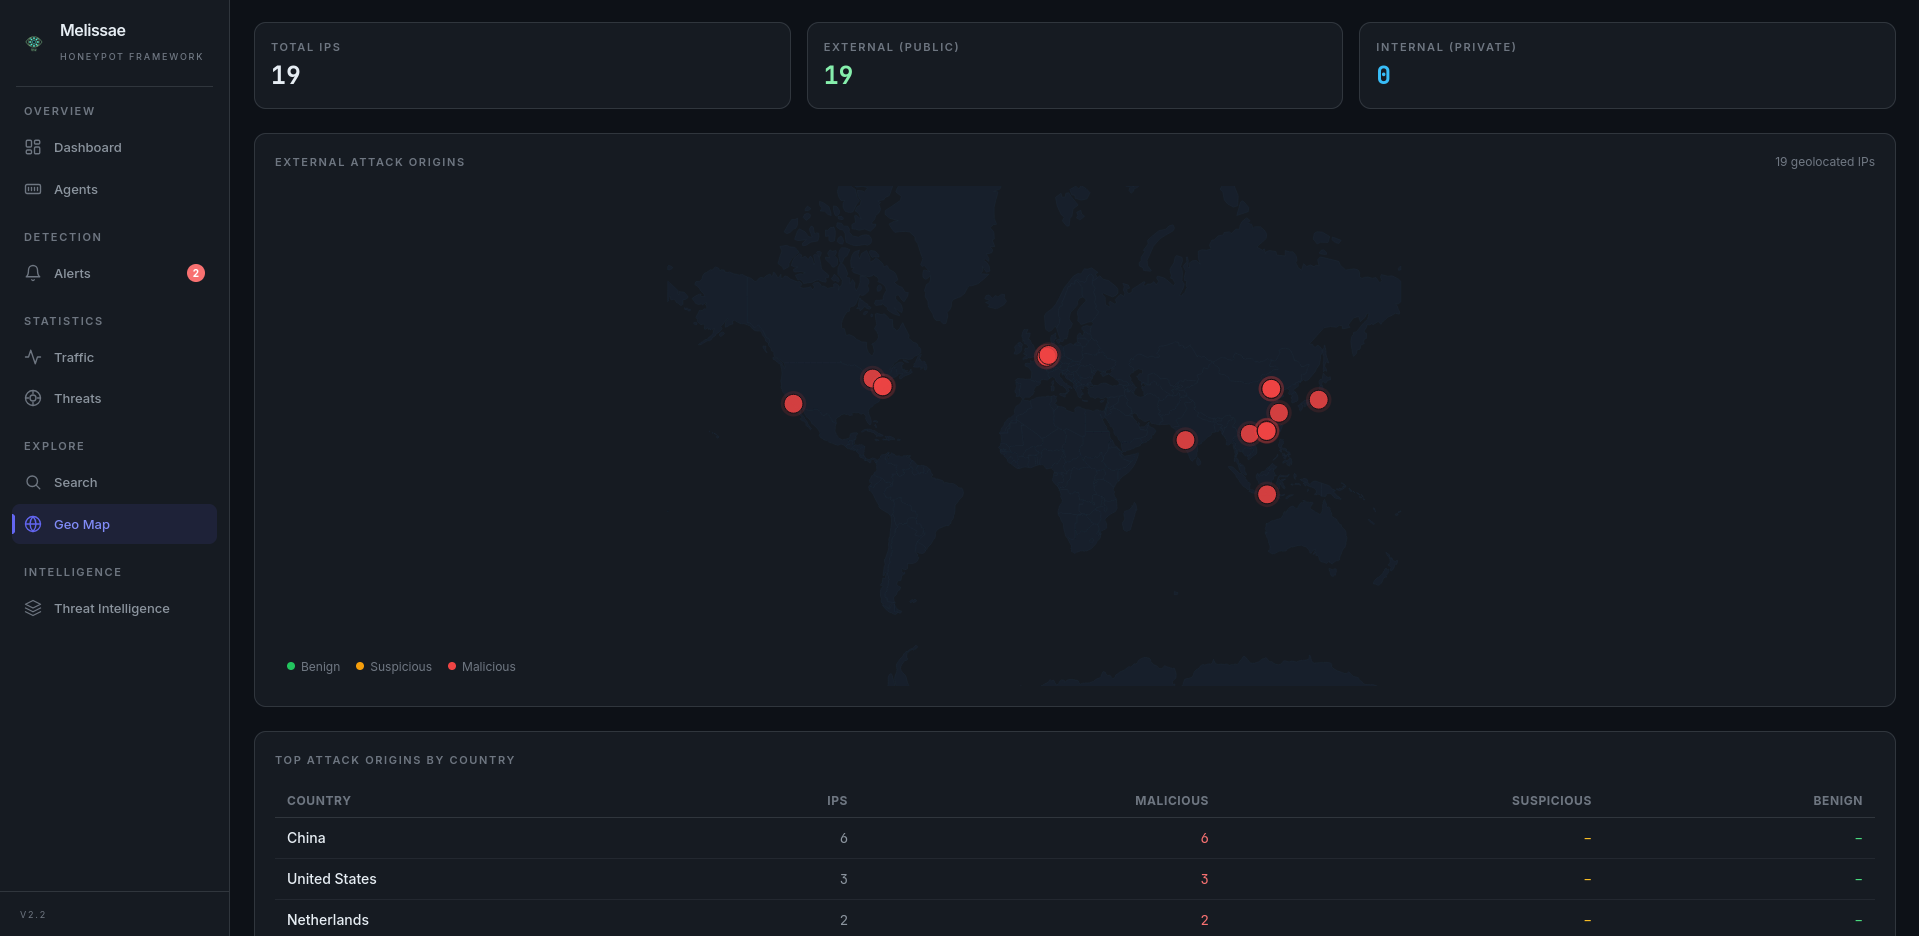
The /map page automatically adapts its display based on the types of IPs detected:
IP mix |
Display |
|---|---|
All private IPs |
Summary stats + Internal Network Threats table |
All public IPs |
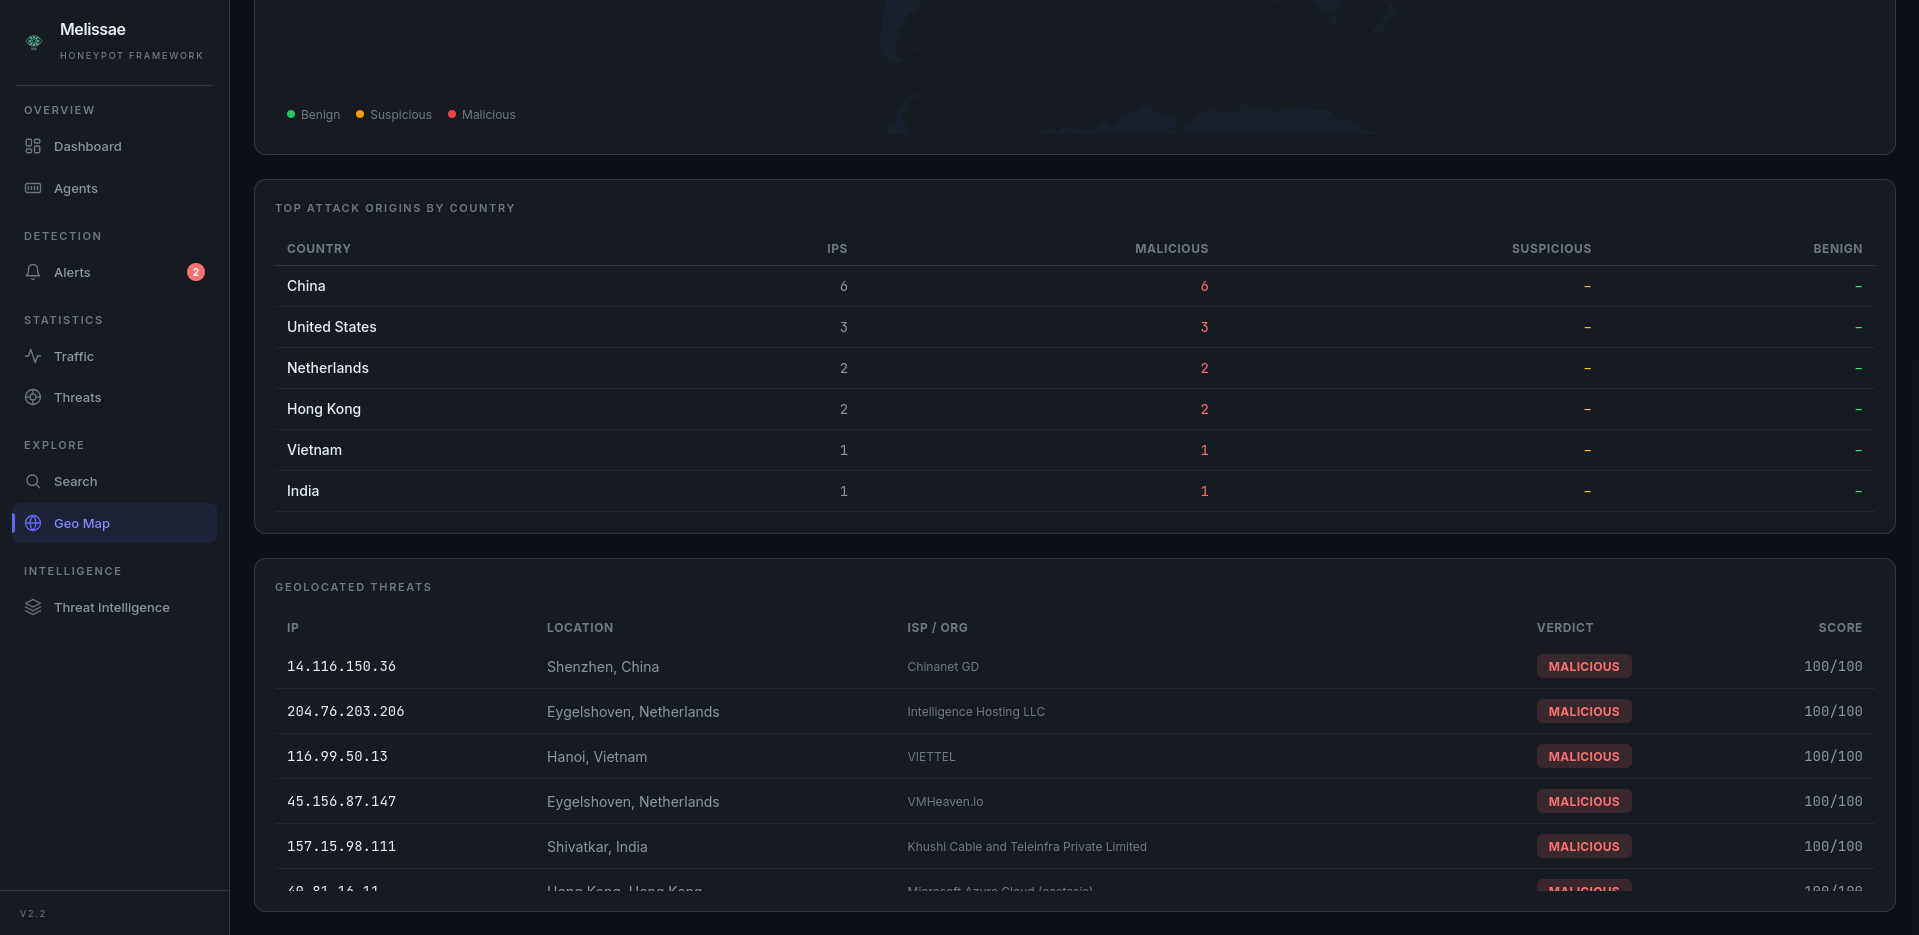
Summary stats + Interactive world map + Country breakdown + Geolocated threats table |
The detection is automatic — public IPs are geolocated and shown on the map, private IPs are listed in a separate table. No configuration needed.
GeoIP Enrichment: Public IPs are geolocated via ip-api.com batch API (free tier, no API key). Results are cached in MongoDB, coordinates validated, and all fields sanitized before storage.
Search Engine#
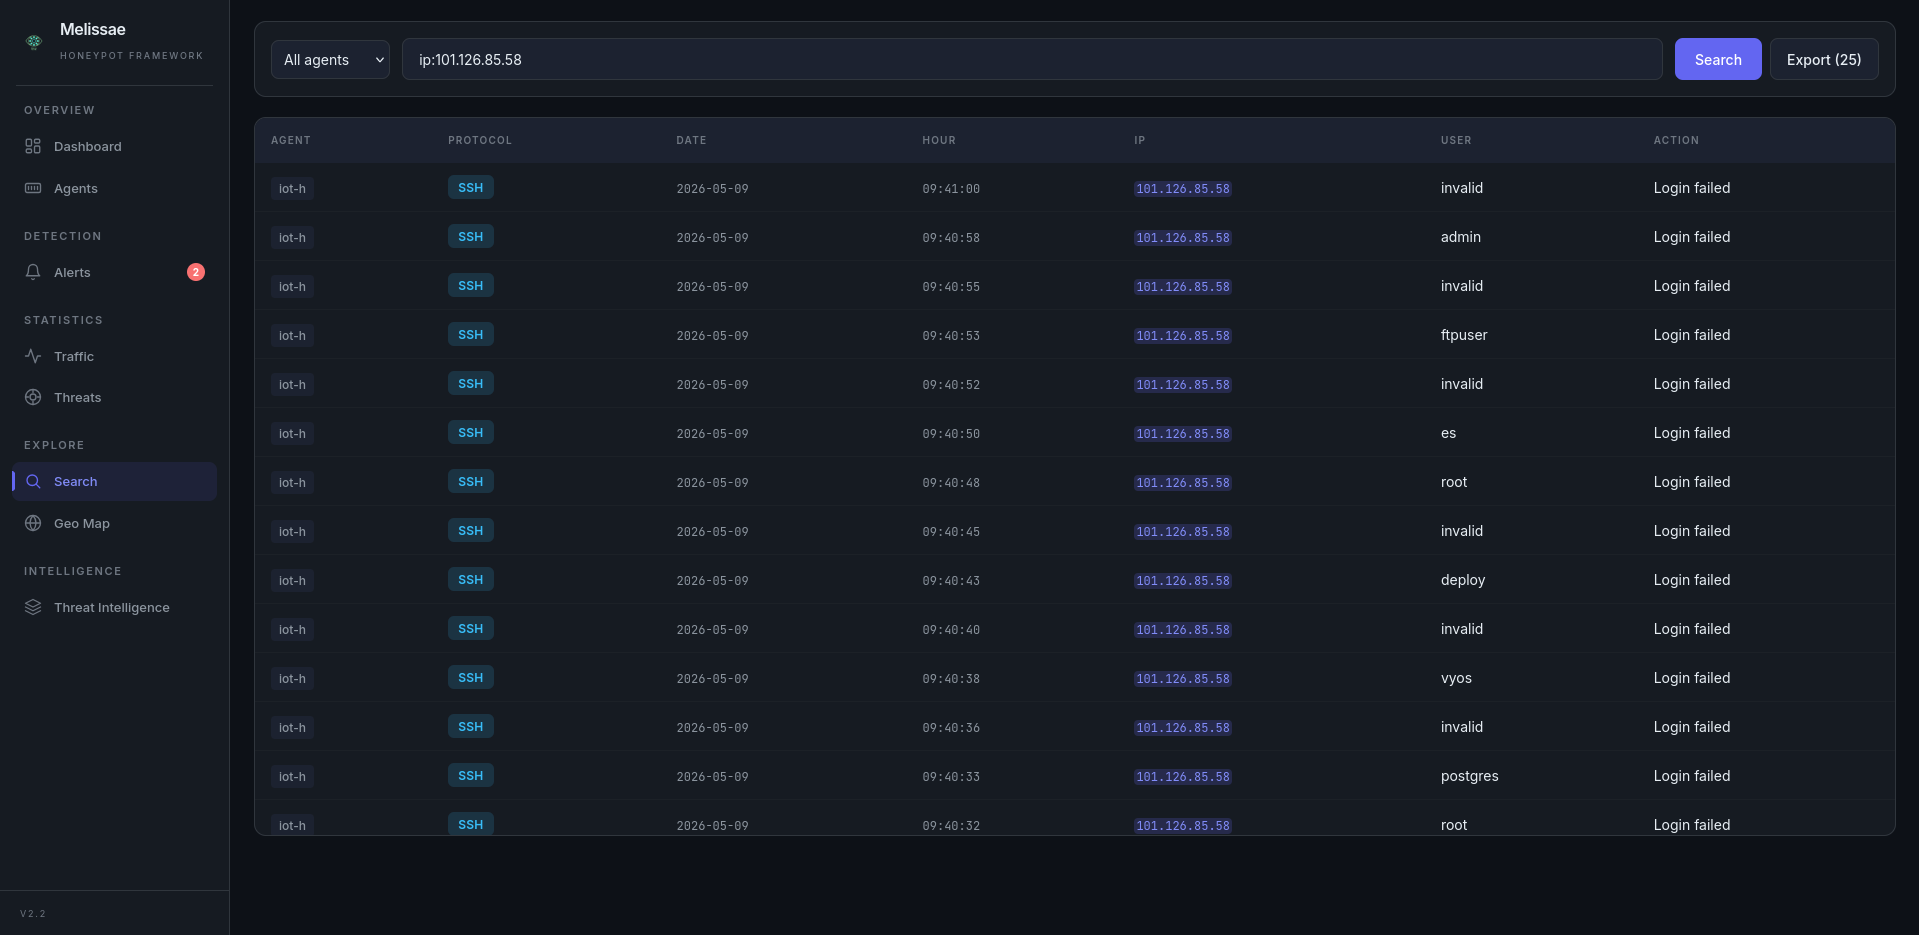
Features:
Backed by the API — Logs are loaded from
/api/logs(MongoDB).Search with logical operators — Use operators to combine multiple criteria in your search.
Field-specific filters — Search within specific fields like
user,ip,protocol,date,hour,action,user-agent,path, orcveusing the syntaxfield:value.Sortable Columns — Click any column header to sort ascending/descending.
Pagination — Configurable page sizes (25/50/100/250) with navigation controls.
Agent Filter — Dropdown to scope search results to a specific agent.
Export results — A button allows exporting the filtered logs.
Operators:
AND/andOR/orNOT/not/!
Examples:
user:root and protocol:ssh
ip:192.168.X.X or ip:192.168.X.Y or ip:192.168.X.Z
protocol:http and not action:success
protocol:modbus and action:write
user:admin or not path:/login
!ip:192.168.X.X and action:failed
protocol:modbus and action:read
cve:CVE-2026-24061
protocol:telnet and action:successful
Threat Intelligence#
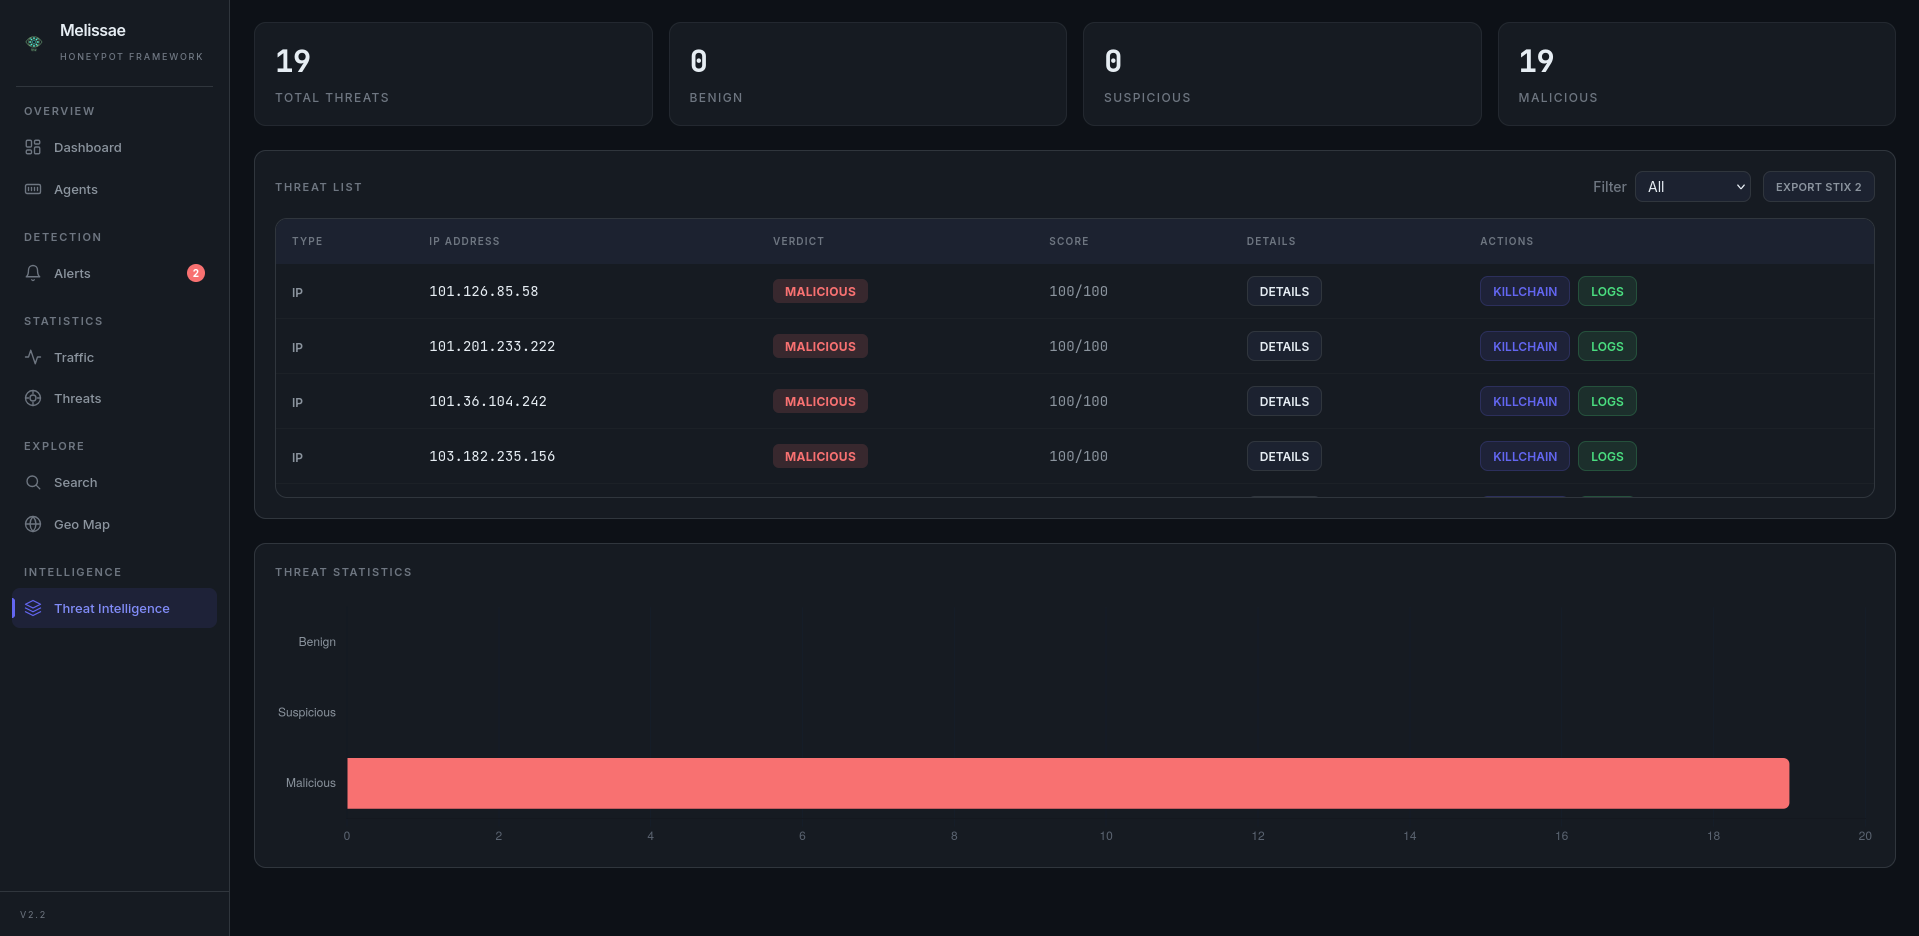
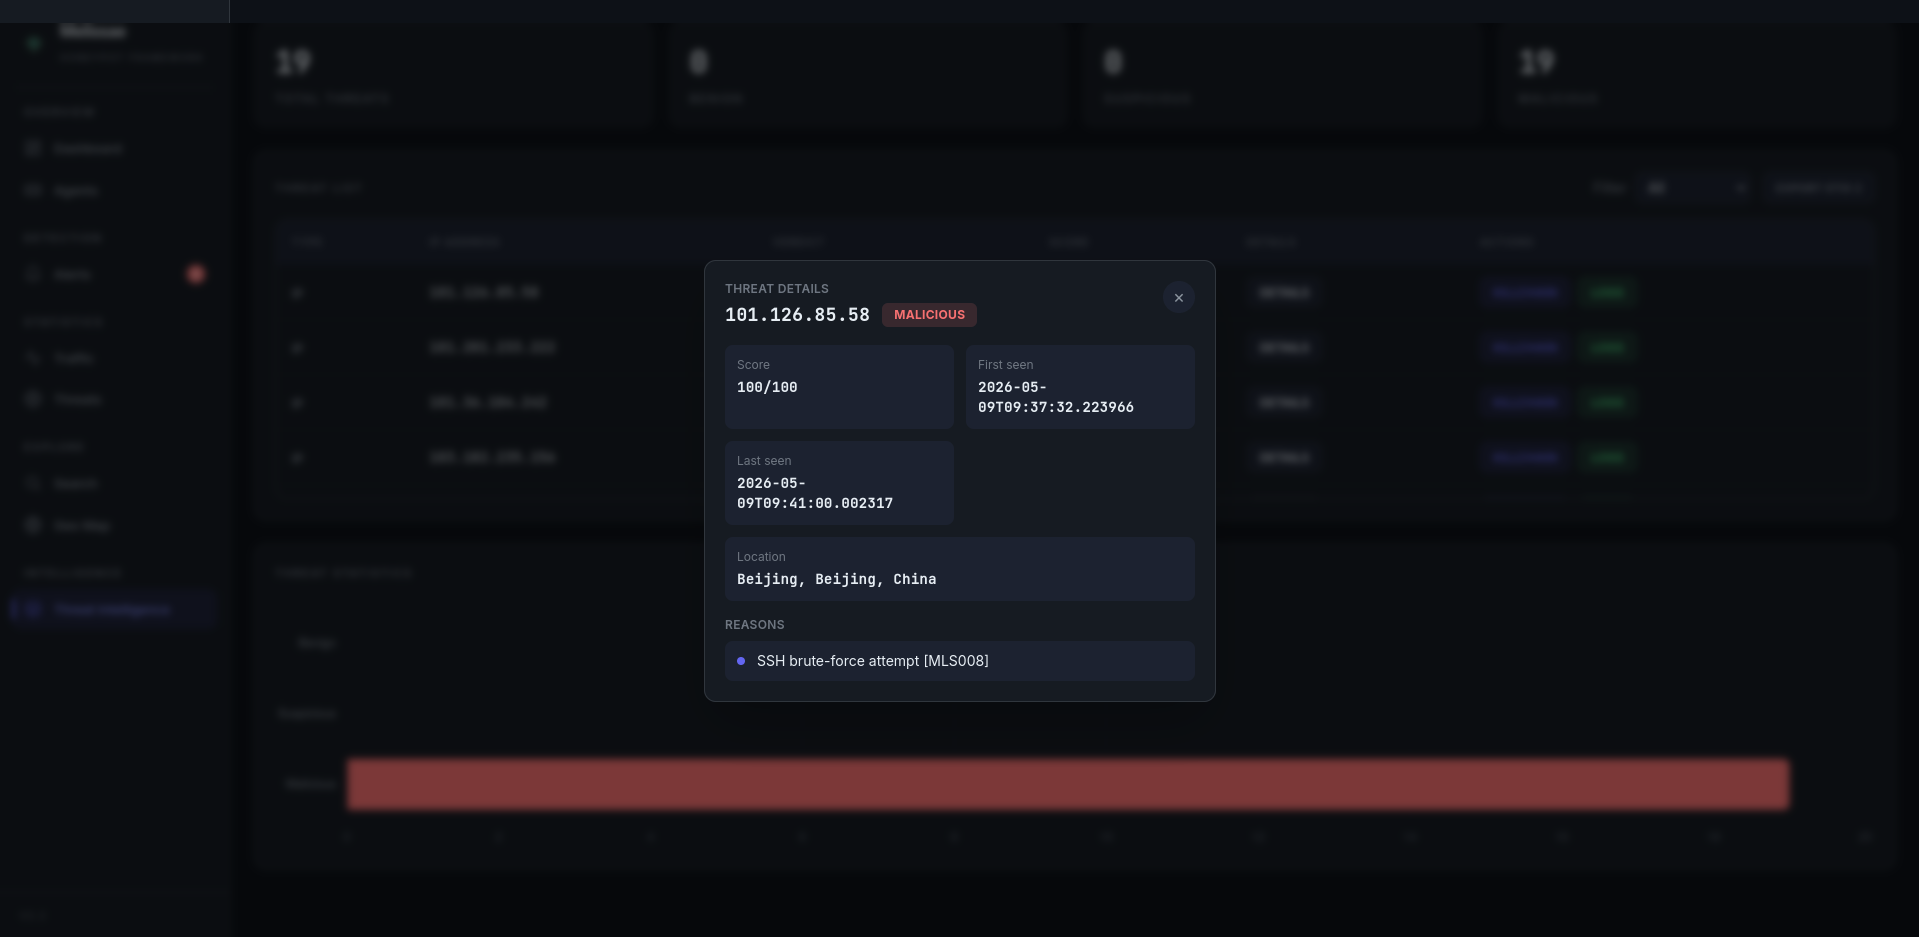
The Threat Intelligence page lists all scored IPs with verdict tags and accumulated rule scores. Each row offers:
Details panel — Modal showing IP, verdict, score/100, timestamps, and the list of rules that matched.
Killchain timeline — Events grouped by protocol with start/end timestamps, ordered from oldest to newest.
STIX 2.1 Export — Download a STIX 2.1 bundle (one indicator per IP) for selected or all threats.
Alerts#
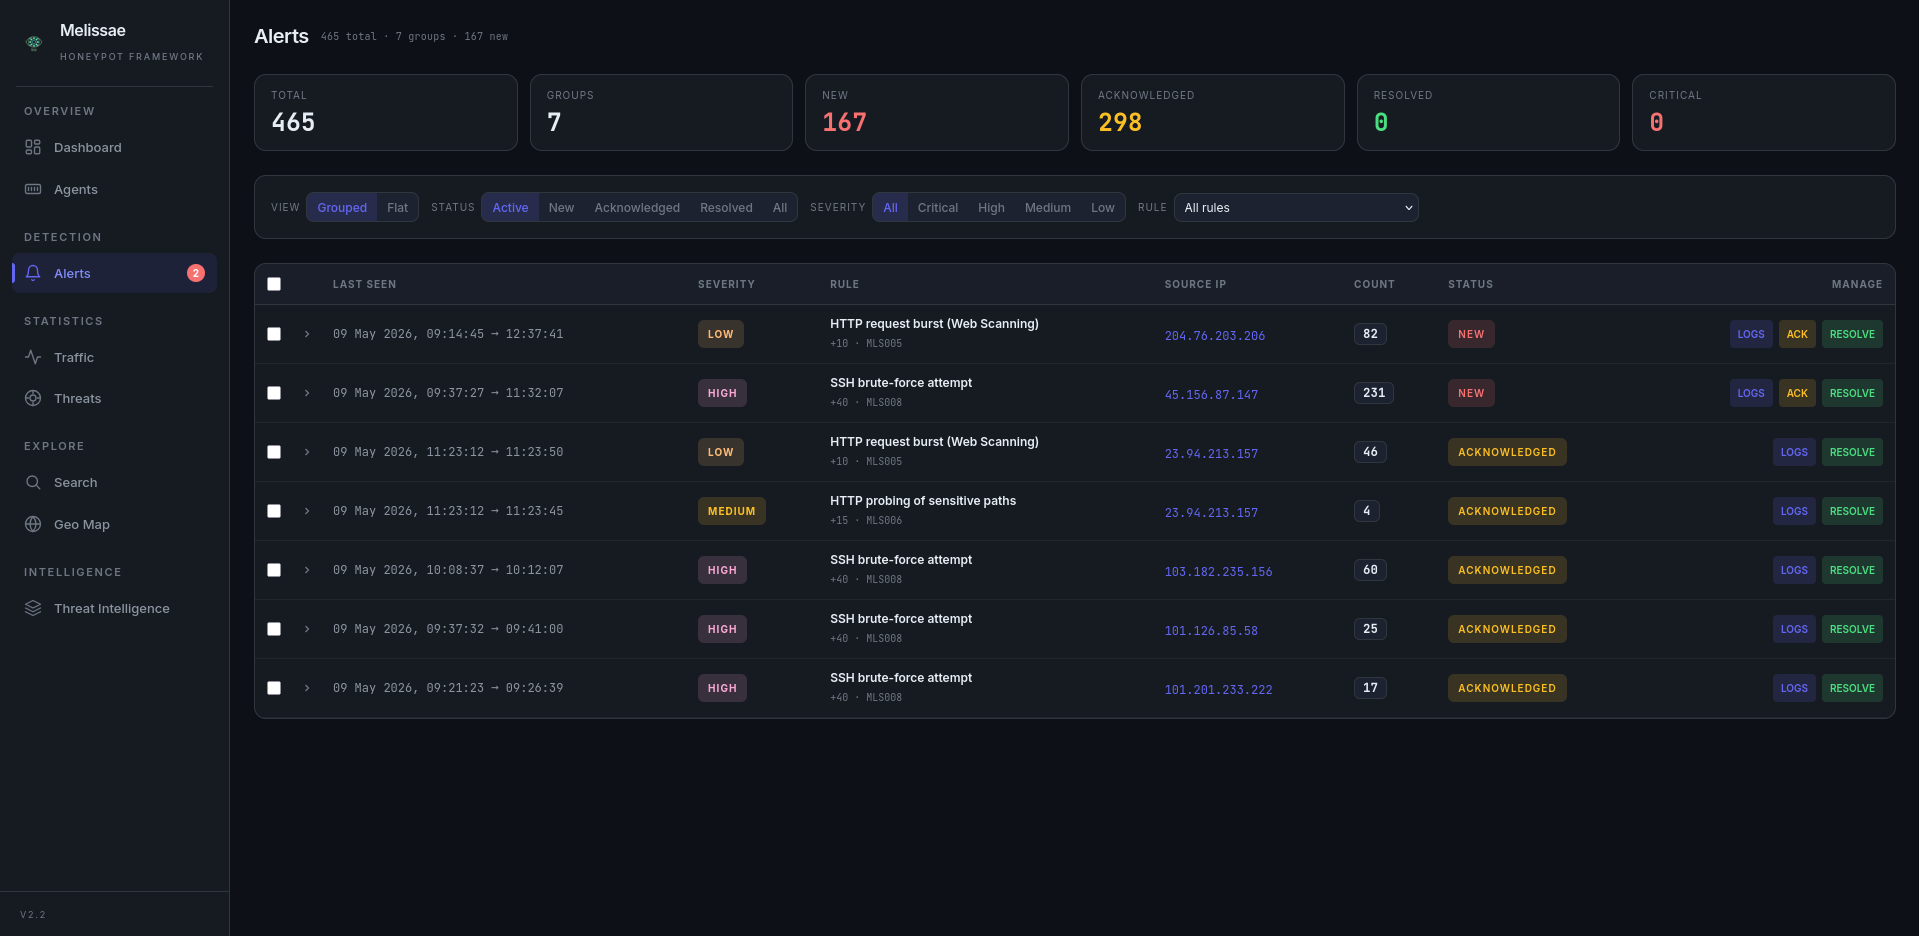
The /alerts page is the primary surface for the rule-based alerting engine introduced in v2.2.
Two view modes — Grouped (one row per
rule_id+ IP, with last seen and hit count) or Flat (one row per individual alert).Filters — Status (
new/acknowledged/resolved/ All) and severity (critical/high/medium/low).Bulk actions — Select multiple alerts and acknowledge or resolve them in a single request.
Auto-refresh — New alerts appear every 20 seconds.
Drill-down — Each alert links to the matching IP killchain and to the underlying logs.
Agent Topology#
A dedicated interactive canvas rendering the live deployment as a graph manager ↔ agents ↔ modules:
Drag-and-drop positioning of any node, with positions persisted in
localStorage.Zoom / pan / fit-to-view controls.
Per-protocol coloring of module nodes (SSH, HTTP, FTP, Modbus, MQTT, Telnet).
Live health overlay reusing the same data feed as the Agents page.
Activity & Attacker Statistics#
Two dedicated statistics pages complement the main dashboard:
/stats/activity— traffic patterns over time (volumes, protocol mix, hourly distribution, day×hour heatmap)./stats/attackers— per-attacker breakdowns (top IPs, top credentials, top user-agents, geo distribution).
Rules#
The API exposes the catalog of YAML rules at GET /api/rules together with last-run metadata (last_run_at, last_alerts_emitted, last_groups_triggered). The dashboard surfaces this catalog so reviewers can see at a glance which rules are enabled, their severity, MQL query, threshold and contribution to the score.