
Dashboard#
Overview Dashboard#
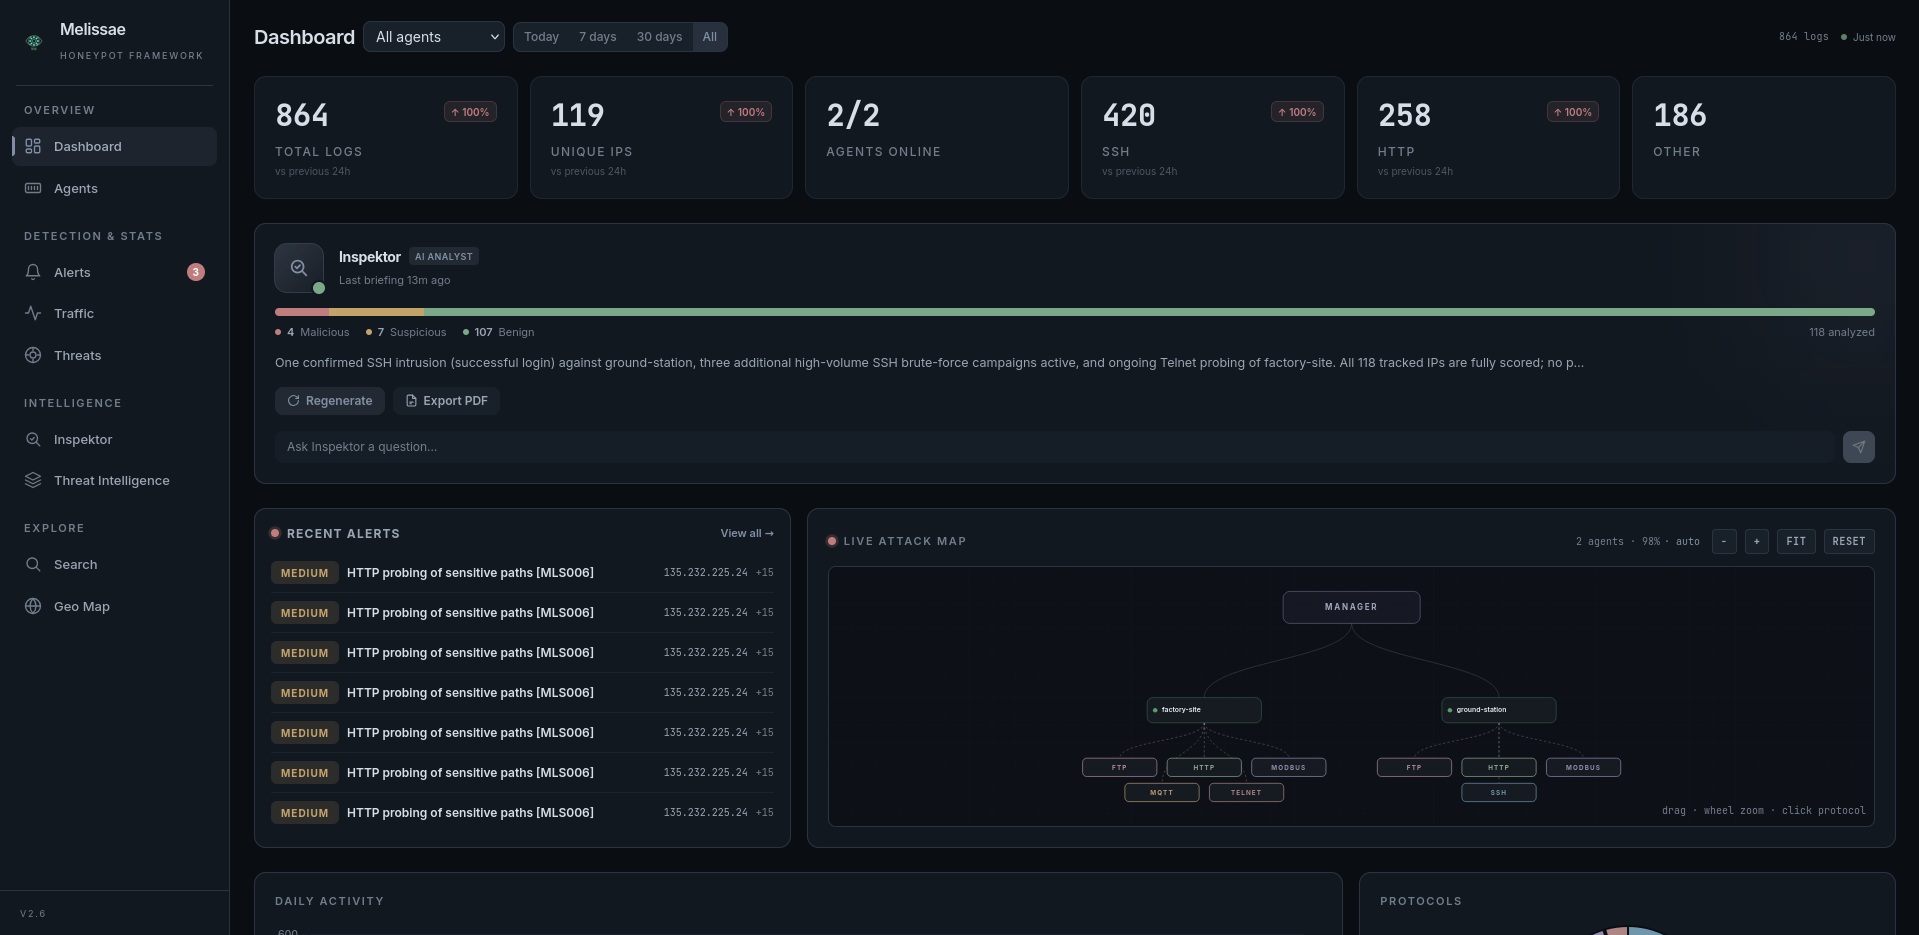
The main view provides a comprehensive real-time overview:
Stat Cards with trend arrows — Total events, unique IPs, malicious verdicts, per-protocol breakdowns. Each card shows a percentage change vs the previous 24h (↑/↓ indicators).
Date Range Filter — Toggle between Today, 7 days, 30 days, or All to scope the dashboard.
Auto-Refresh — Dashboard data refreshes every 30 seconds with a live “Xs ago” indicator.
Multi-Day Timeline — Line chart showing daily event volume over the selected range.
Activity Heatmap — Day-of-week × hour-of-day grid with color intensity, revealing peak attack windows.
Activity Bar Chart — Hourly event distribution.
Protocol Doughnut — Visual breakdown of traffic by protocol.
Agent Bar Chart — Event volume per agent.
Top Attackers List — Top attacking IPs with country flags (via GeoIP enrichment).
Top Credentials — Top 10 attempted usernames across SSH/FTP/Telnet with hit counts.
Inspektor Briefing Card — Compact recap of the latest AI threat briefing (when Inspektor is enabled), anchored on the Posture line. Clicking the card opens the full Inspektor page.
Critical Events Section: When security-critical events are detected (CVE exploits, successful logins on Telnet/SSH/FTP, Modbus write attempts), a highlighted alert section appears at the top of the dashboard with red-themed cards showing event counts.
Agents Page#
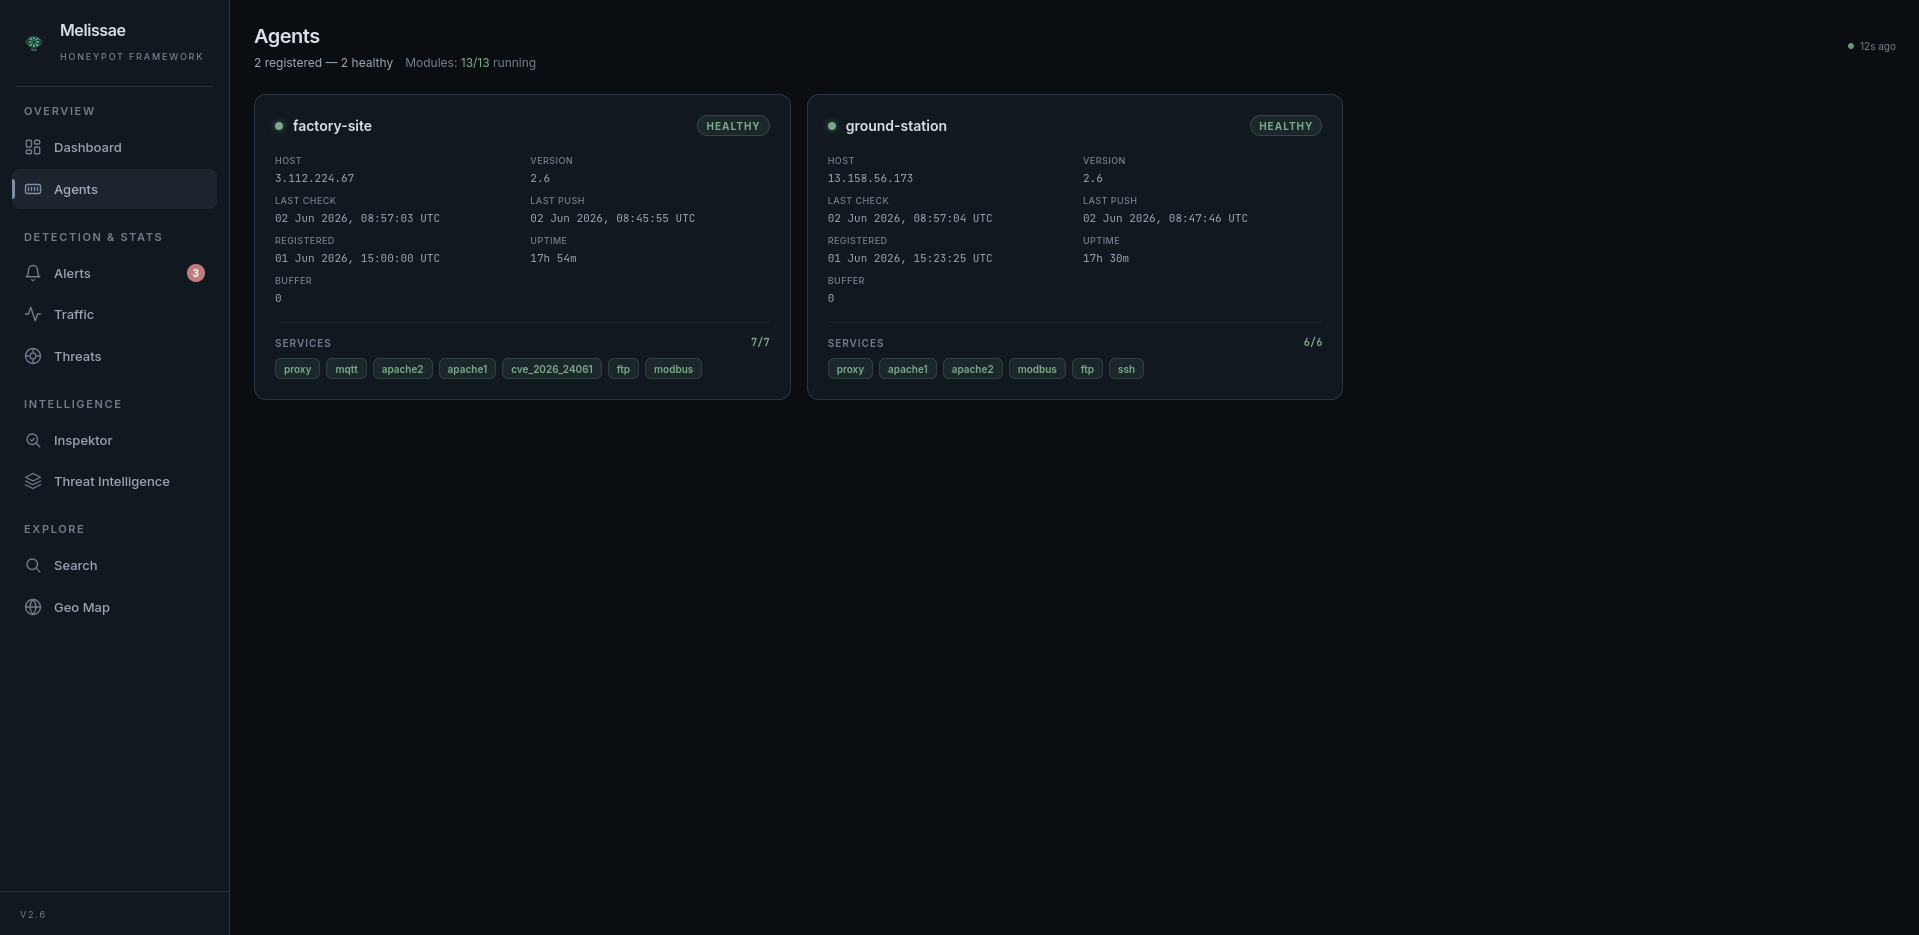
The /agents page provides real-time visibility into the agent fleet (auto-refreshes every 15s):
Status indicator (healthy / degraded / unreachable / pending) with color coding
Host address, last push time, last health check
Active modules per agent with running/stopped state, aggregate running/total count
Buffer pending count and uptime
Live refresh indicator with “Xs ago” counter
GeoIP Attack Map#
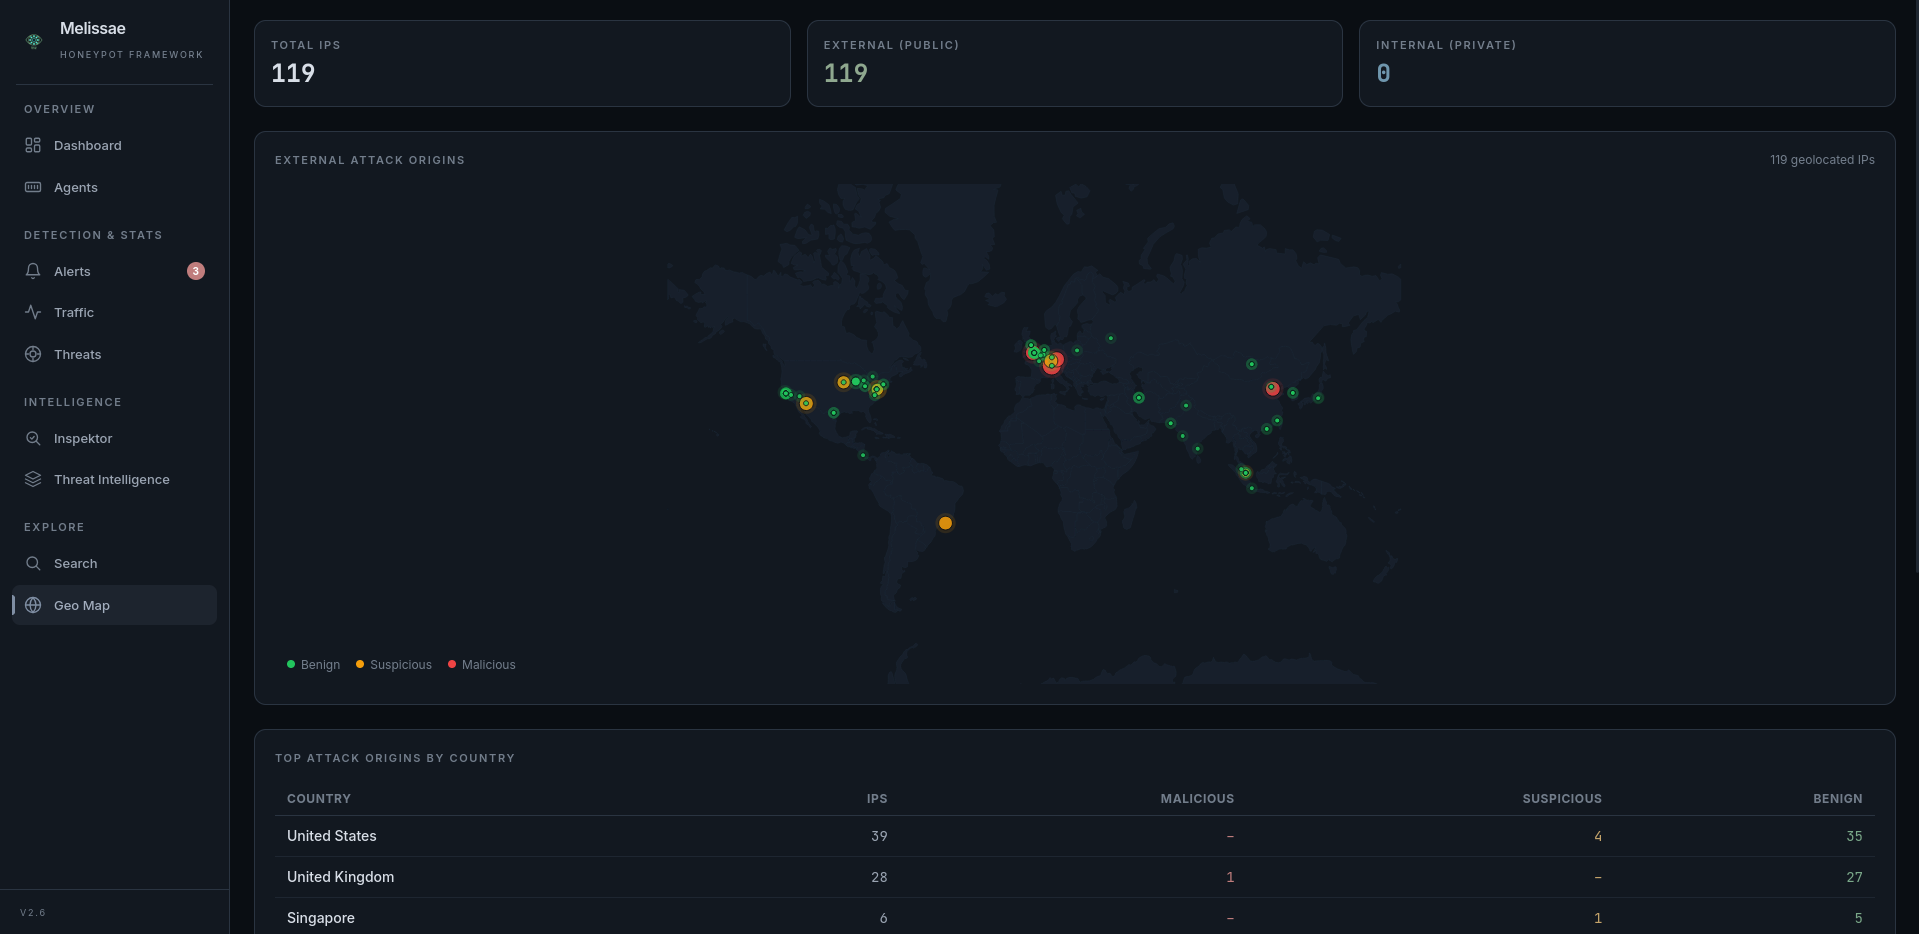
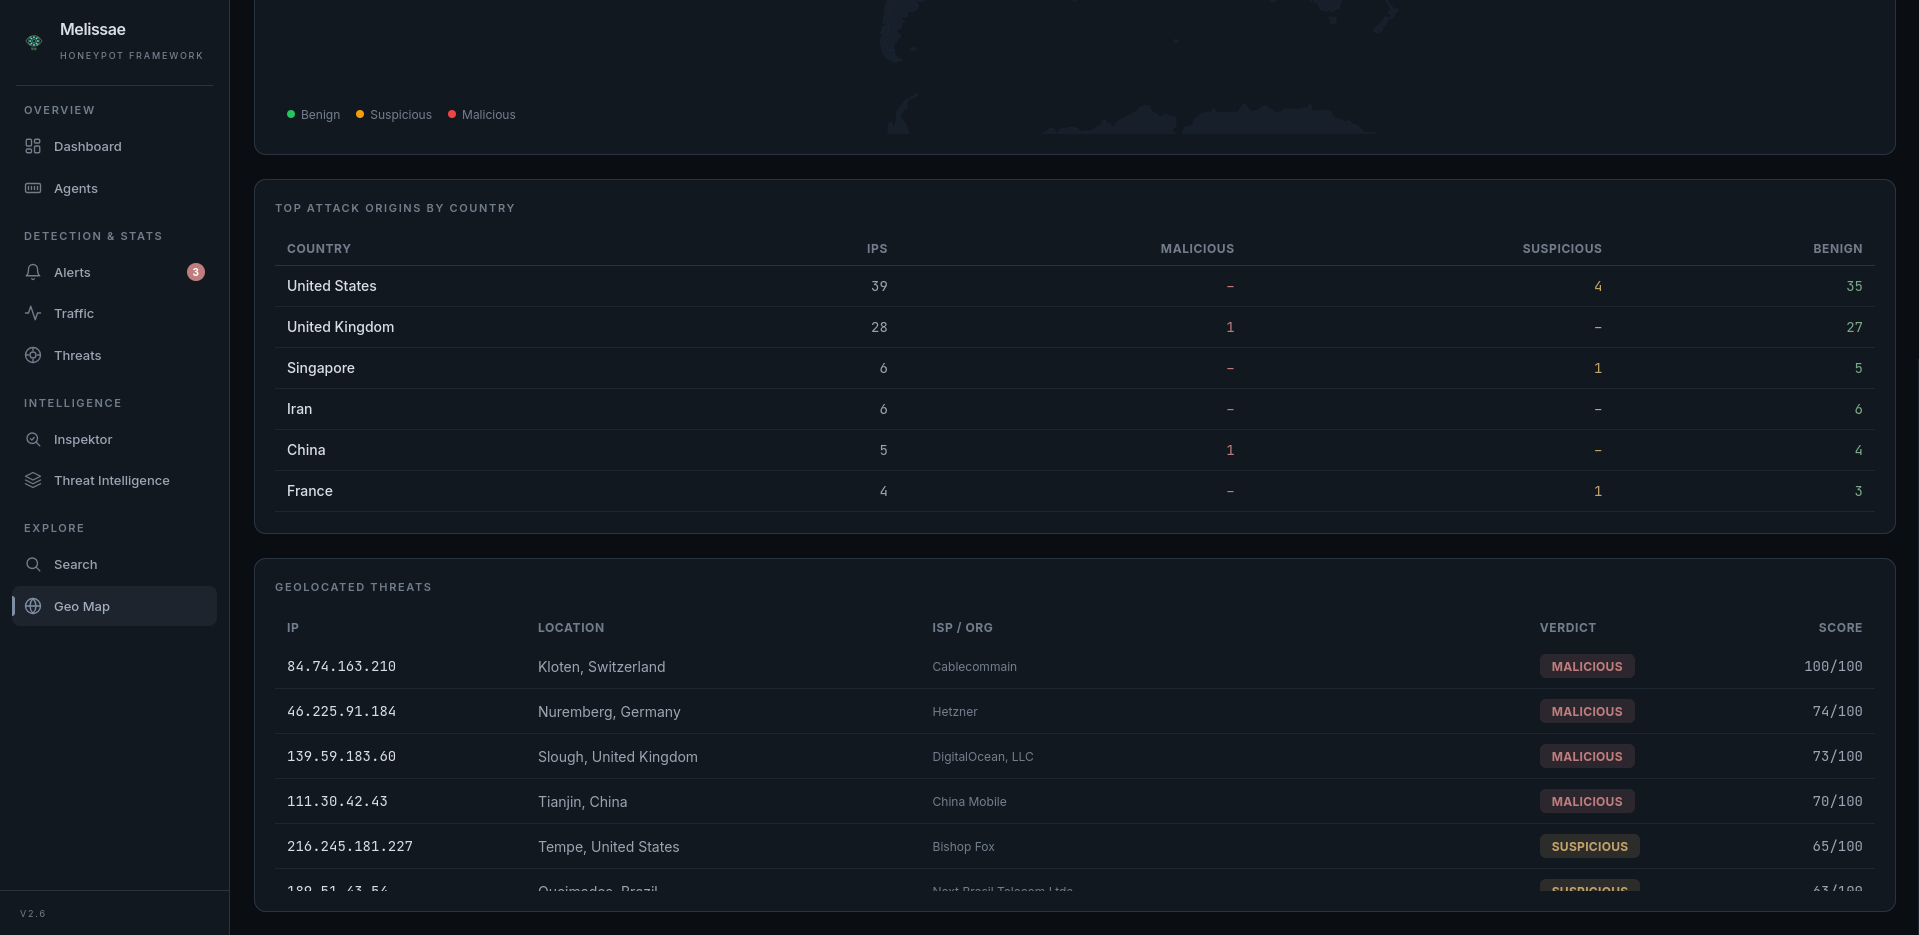
The /map page automatically adapts its display based on the types of IPs detected:
IP mix |
Display |
|---|---|
All private IPs |
Summary stats + Internal Network Threats table |
All public IPs |
Summary stats + Interactive world map + Country breakdown + Geolocated threats table |
The detection is automatic — public IPs are geolocated and shown on the map, private IPs are listed in a separate table. No configuration needed.
GeoIP Enrichment: Public IPs are geolocated via ip-api.com batch API (free tier, no API key). Results are cached in MongoDB, coordinates validated, and all fields sanitized before storage.
Search Engine#
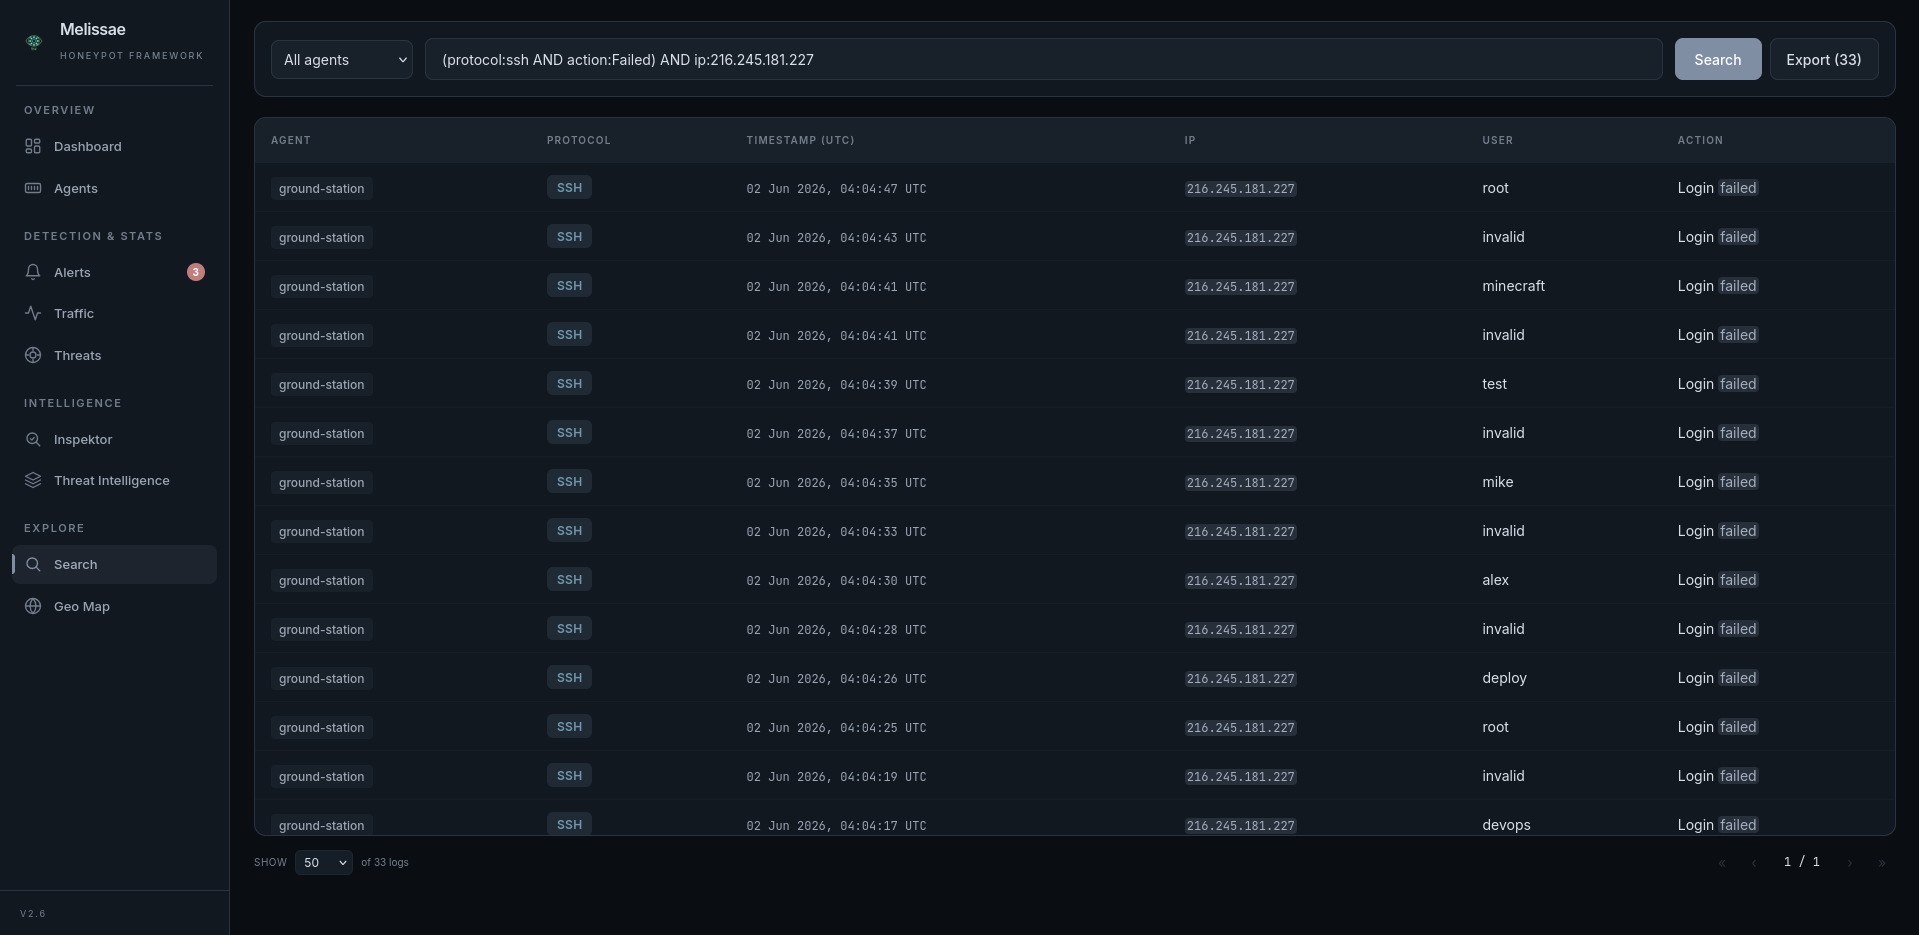
Features:
Backed by the API — Logs are loaded from
/api/logs(MongoDB).Search with logical operators — Use operators to combine multiple criteria in your search.
Field-specific filters — Search within specific fields like
user,ip,protocol,date,hour,action,user-agent,path, orcveusing the syntaxfield:value.Sortable Columns — Click any column header to sort ascending/descending.
Pagination — Configurable page sizes (25/50/100/250) with navigation controls.
Agent Filter — Dropdown to scope search results to a specific agent.
Export results — A button allows exporting the filtered logs.
Operators:
AND/andOR/orNOT/not/!
Examples:
user:root and protocol:ssh
ip:192.168.X.X or ip:192.168.X.Y or ip:192.168.X.Z
protocol:http and not action:success
protocol:modbus and action:write
user:admin or not path:/login
!ip:192.168.X.X and action:failed
protocol:modbus and action:read
cve:CVE-2026-24061
protocol:telnet and action:successful
Threat Intelligence#
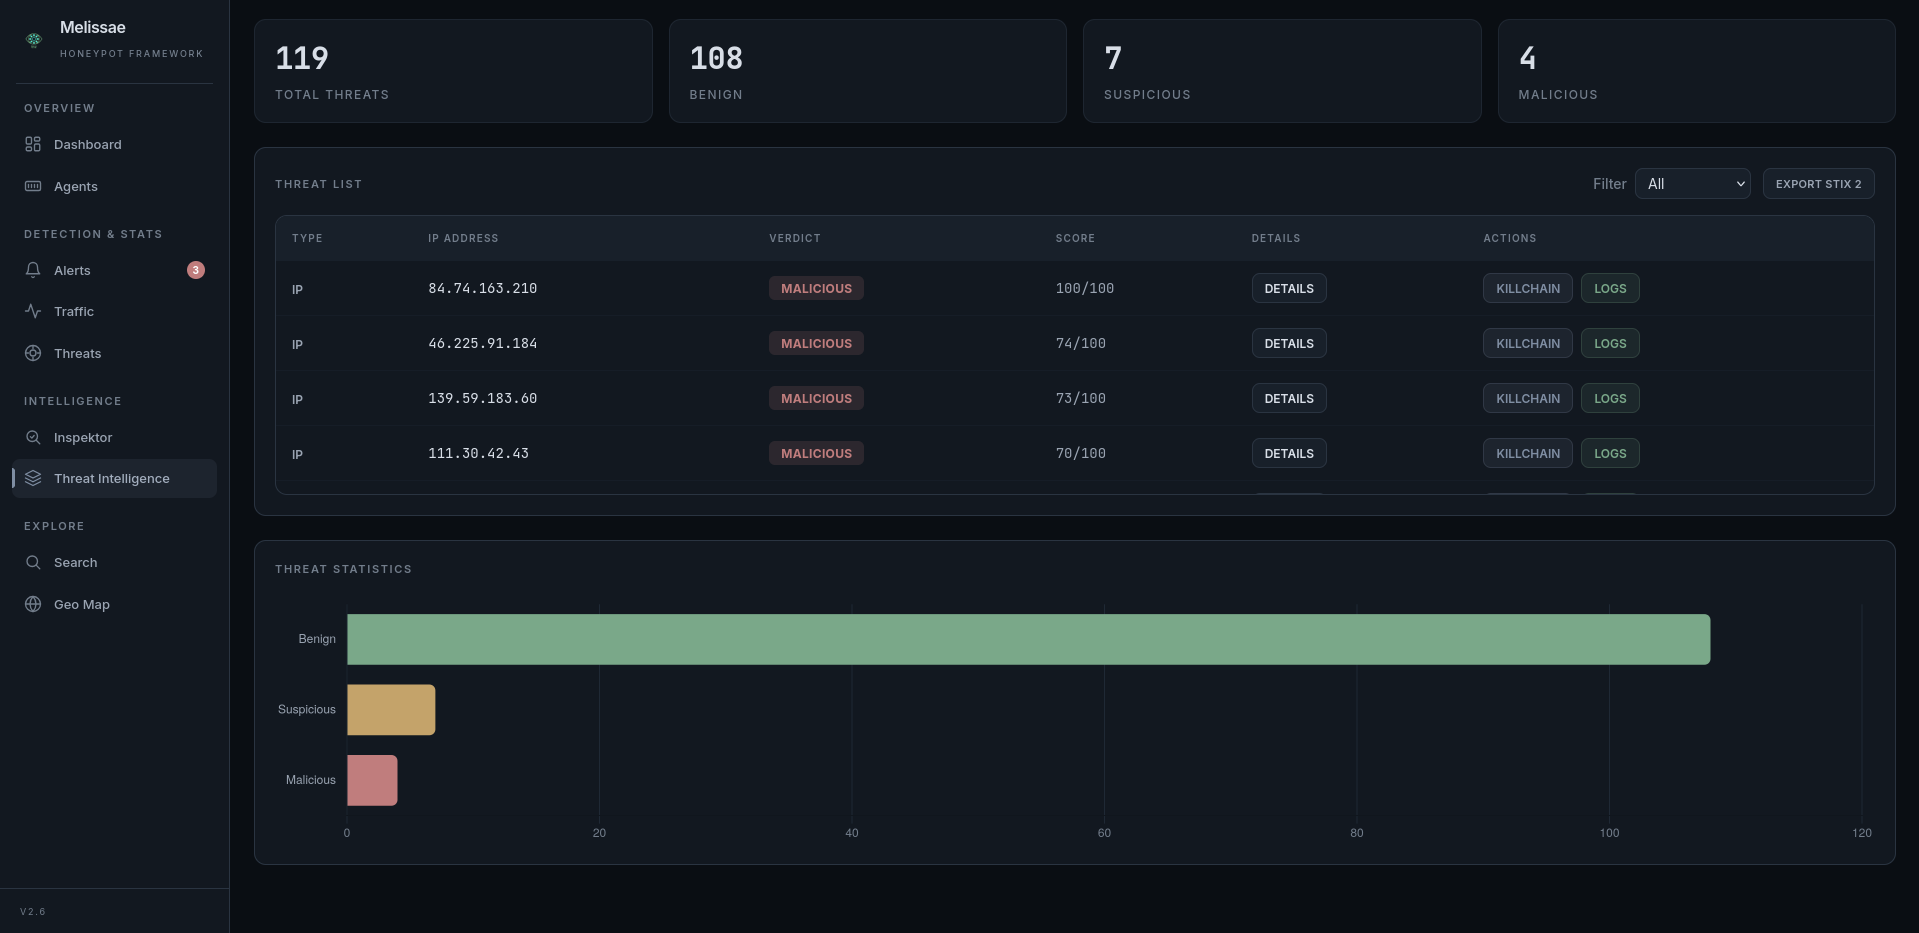
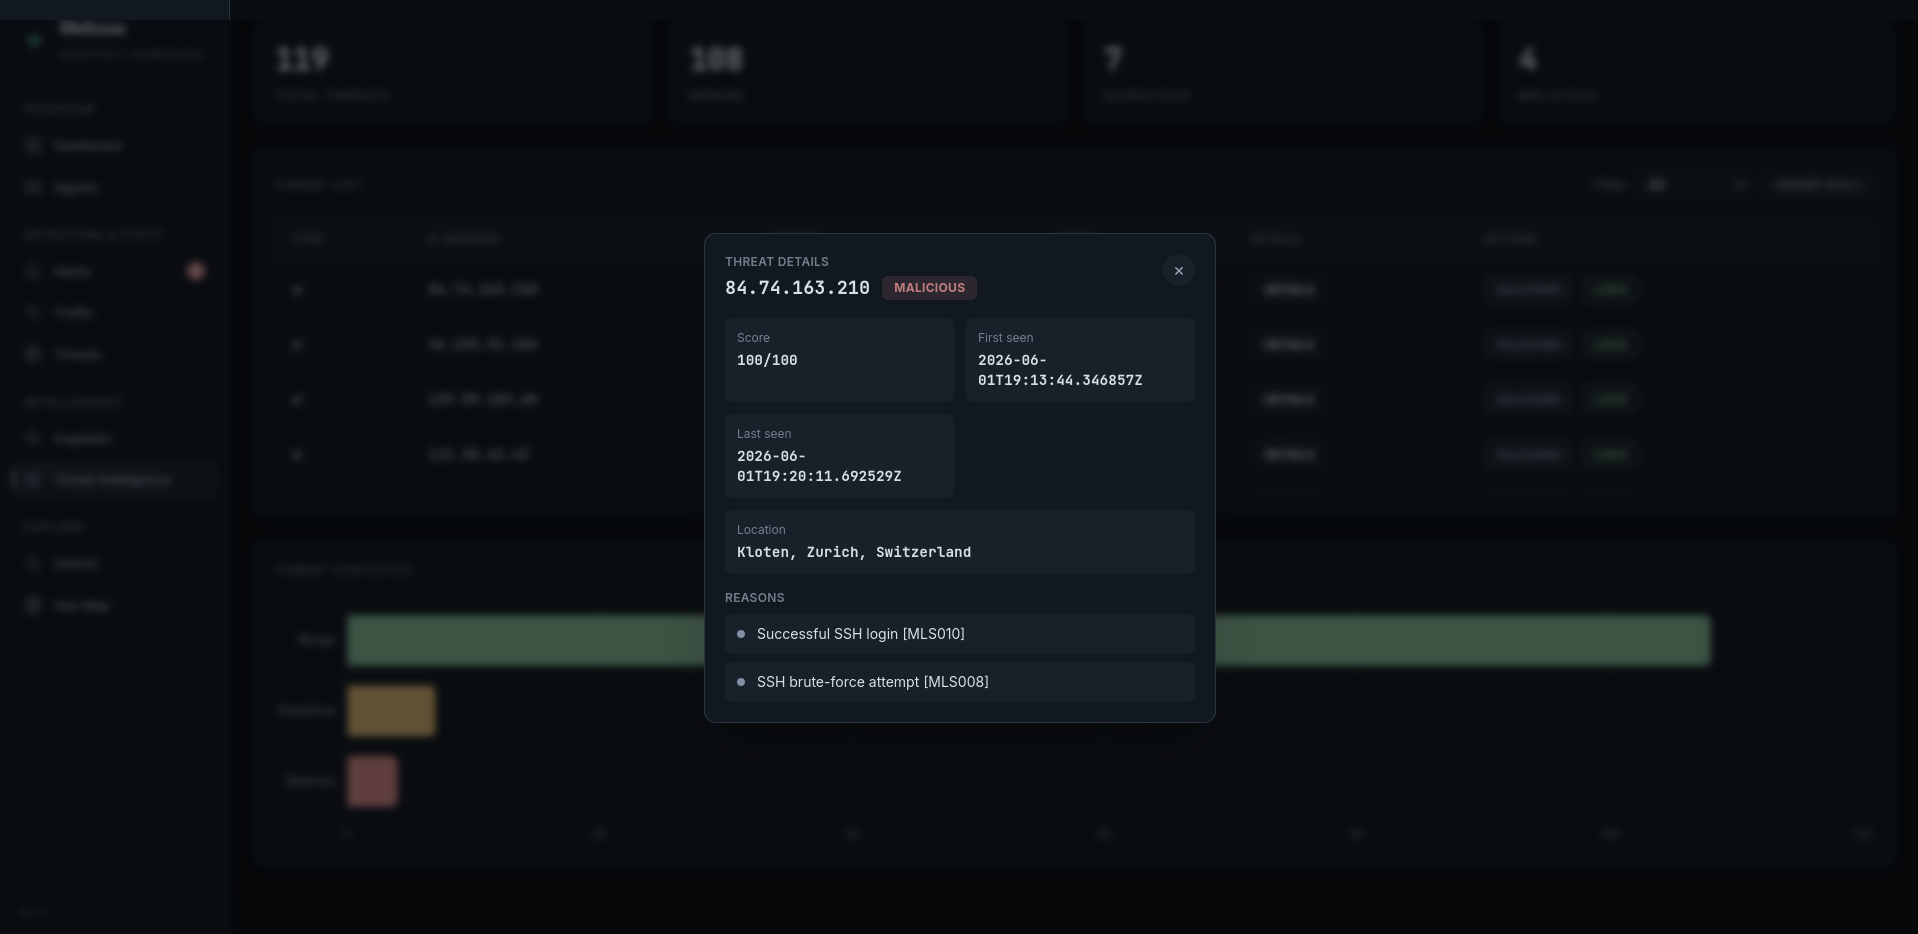
The Threat Intelligence page lists all scored IPs with verdict tags and accumulated rule scores. Each row offers:
Details panel — Modal showing IP, verdict, score/100, timestamps, and the list of rules that matched.
Killchain timeline — Events grouped by protocol with start/end timestamps, ordered from oldest to newest.
STIX 2.1 Export — Download a STIX 2.1 bundle (one indicator per IP) for selected or all threats.
Alerts#
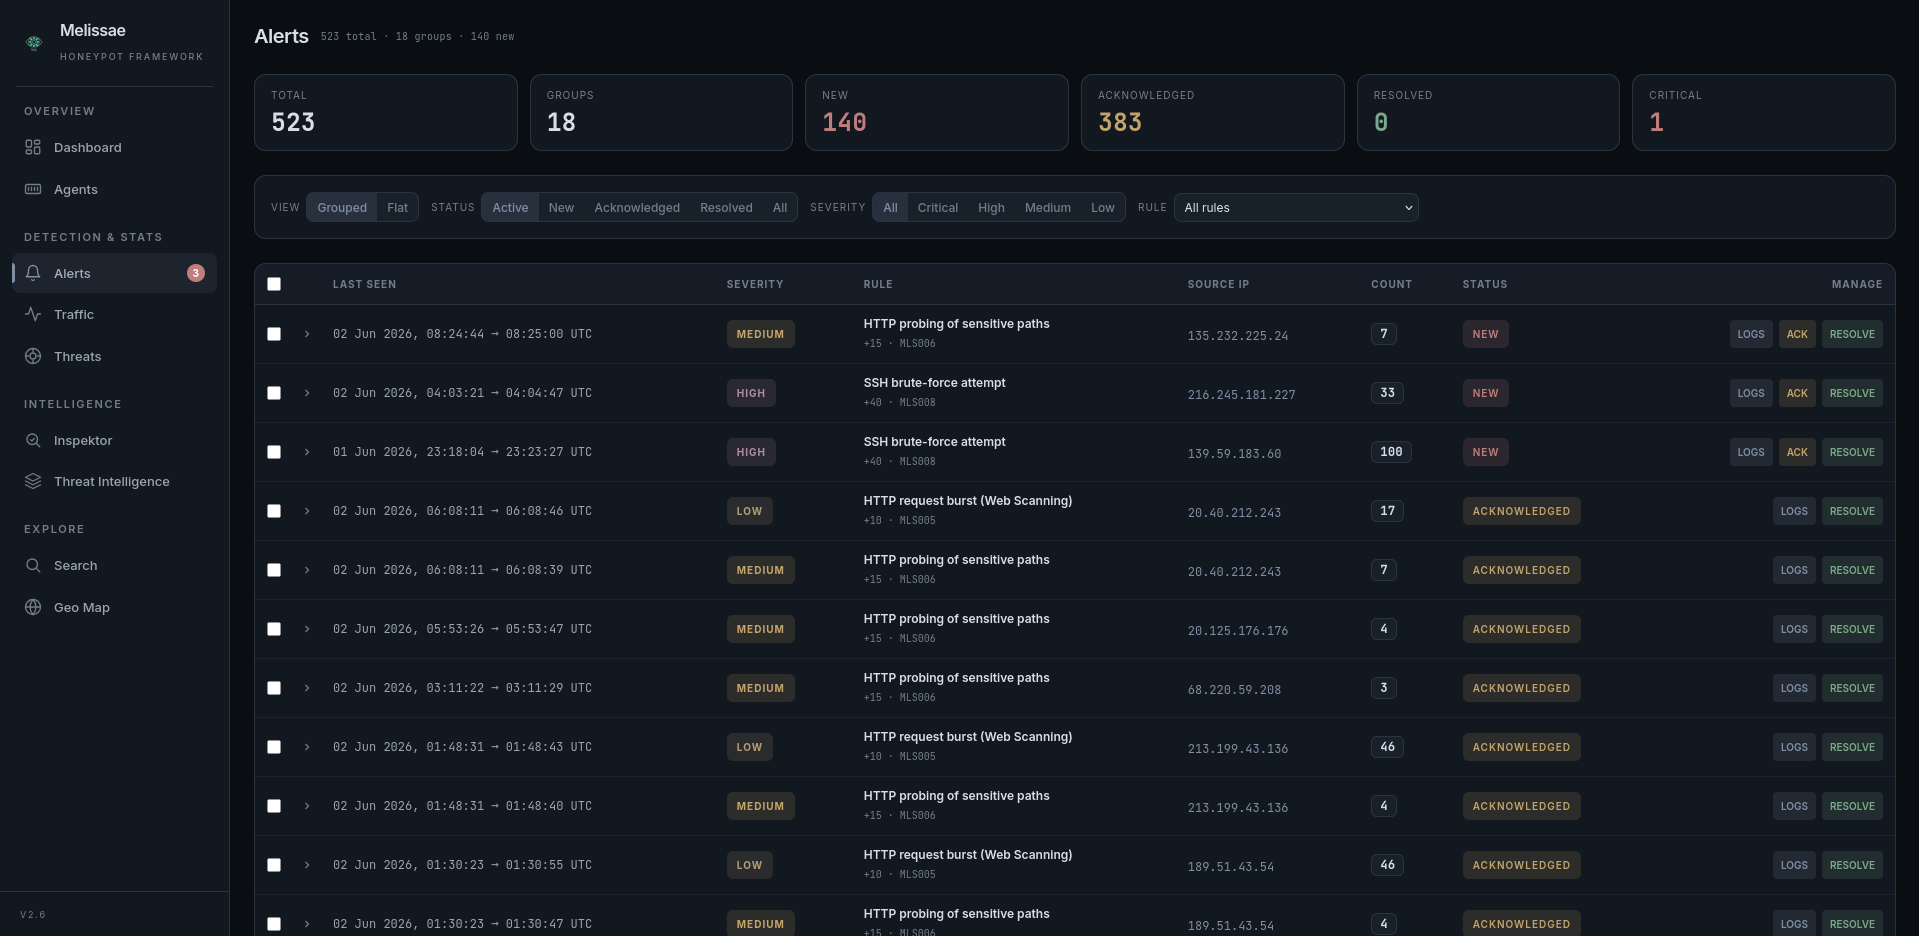
The /alerts page is the primary surface for the rule-based alerting engine introduced in v2.5.
Two view modes — Grouped (one row per
rule_id+ IP, with last seen and hit count) or Flat (one row per individual alert).Filters — Status (
new/acknowledged/resolved/ All) and severity (critical/high/medium/low).Bulk actions — Select multiple alerts and acknowledge or resolve them in a single request.
Auto-refresh — New alerts appear every 20 seconds.
Drill-down — Each alert links to the matching IP killchain and to the underlying logs.
Inspektor (AI Analyst)#
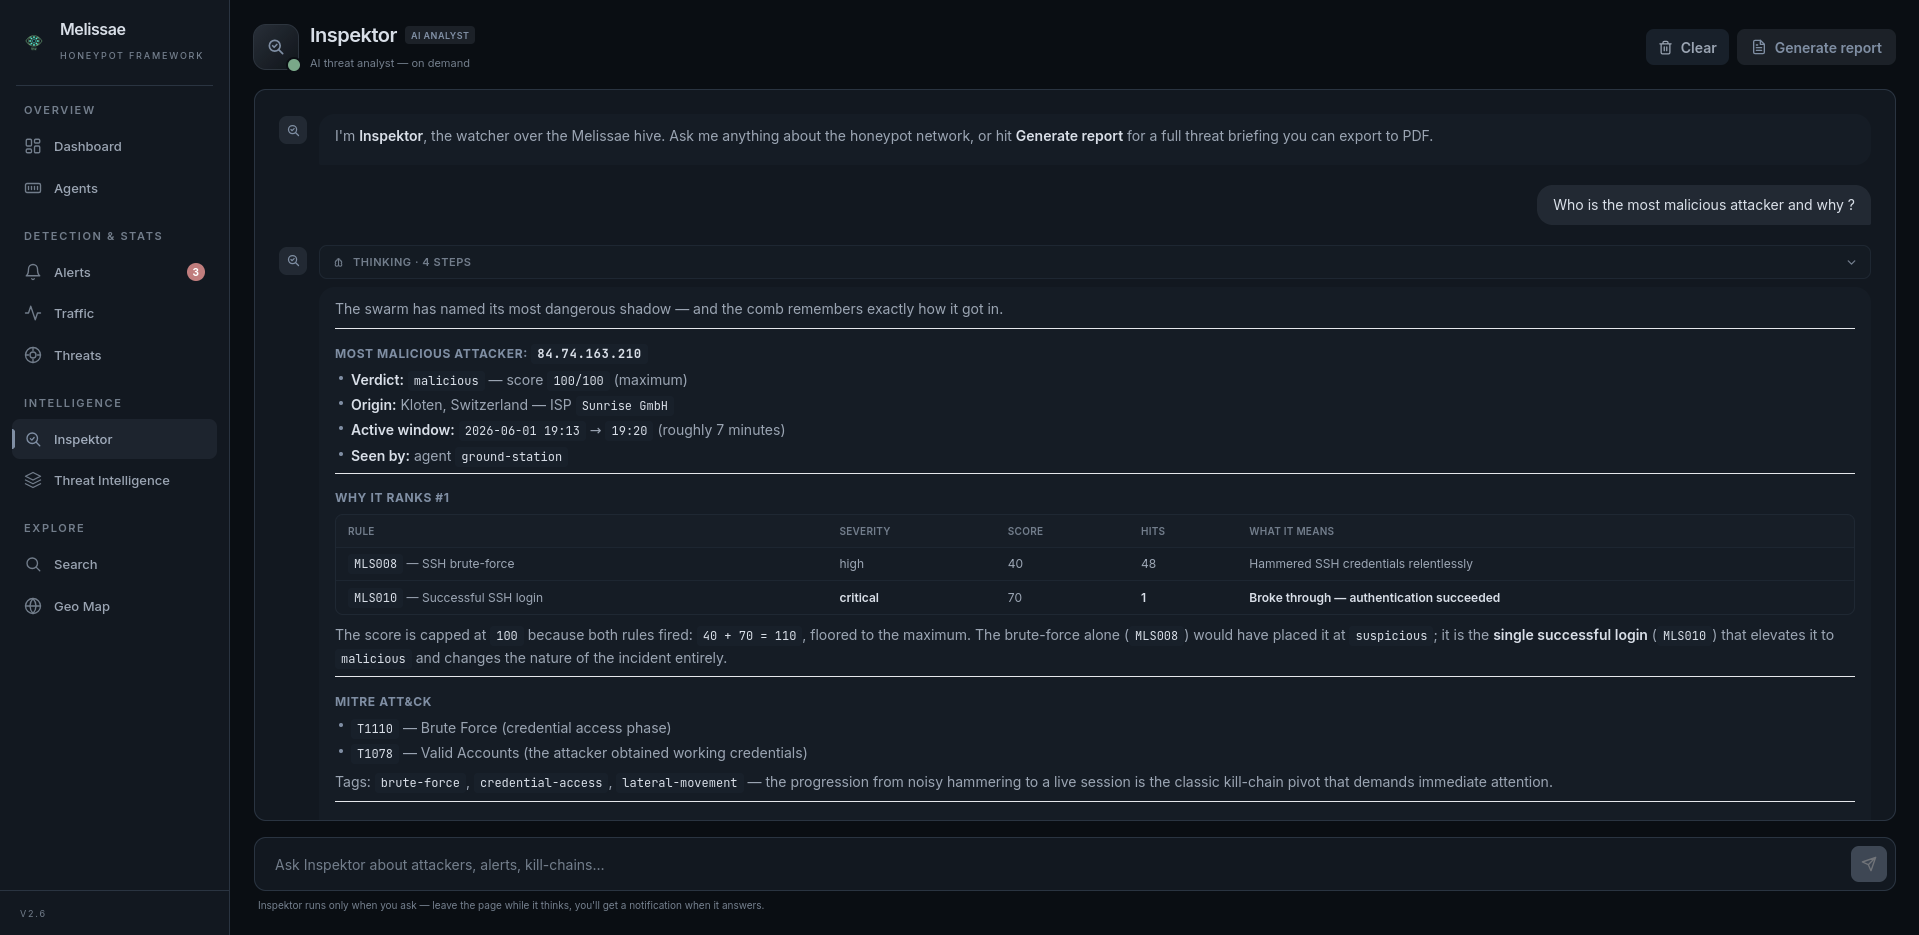
The /inspektor page is the conversational surface for the embedded AI threat
analyst. It is only visible when Inspektor has been enabled from the manager CLI
(see AI Threat Analyst (Inspektor)).
Chat — ask about attackers, alerts, kill-chains or the overall state of the hive and get grounded, technical answers. The conversation is persisted in the browser, so reloading the page keeps the full history.
Thinking trace — every assistant reply ships with a collapsible Thinking panel listing each reasoning step, the tool that was called, its input arguments and the (truncated) output Inspektor observed. Useful both for building trust and for debugging prompts or skills.
Generate report — produces a full threat briefing over the whole honeypot network. The briefing is surfaced in the chat, on the Overview dashboard (compact recap card), and is exportable to PDF via the Export PDF button attached to the briefing message.
Background runs — you can leave the page while Inspektor thinks; a browser notification fires when the answer is ready and an unread badge appears on the navigation entry.
Status pill — a small dot near the header turns amber and pulses while a request is in flight, green when idle.
See AI Threat Analyst (Inspektor) for the architecture, skills, tools and enablement steps.
Agent Topology#
Embedded in the main Overview Dashboard, an interactive canvas renders the live deployment as a graph manager ↔ agents ↔ modules:
Drag-and-drop positioning of any node, with positions persisted in
localStorage.Zoom / pan / fit-to-view controls.
Per-protocol coloring of module nodes (SSH, HTTP, FTP, Modbus, MQTT, Telnet).
Live health overlay reusing the same data feed as the Agents page.
Activity & Attacker Statistics#
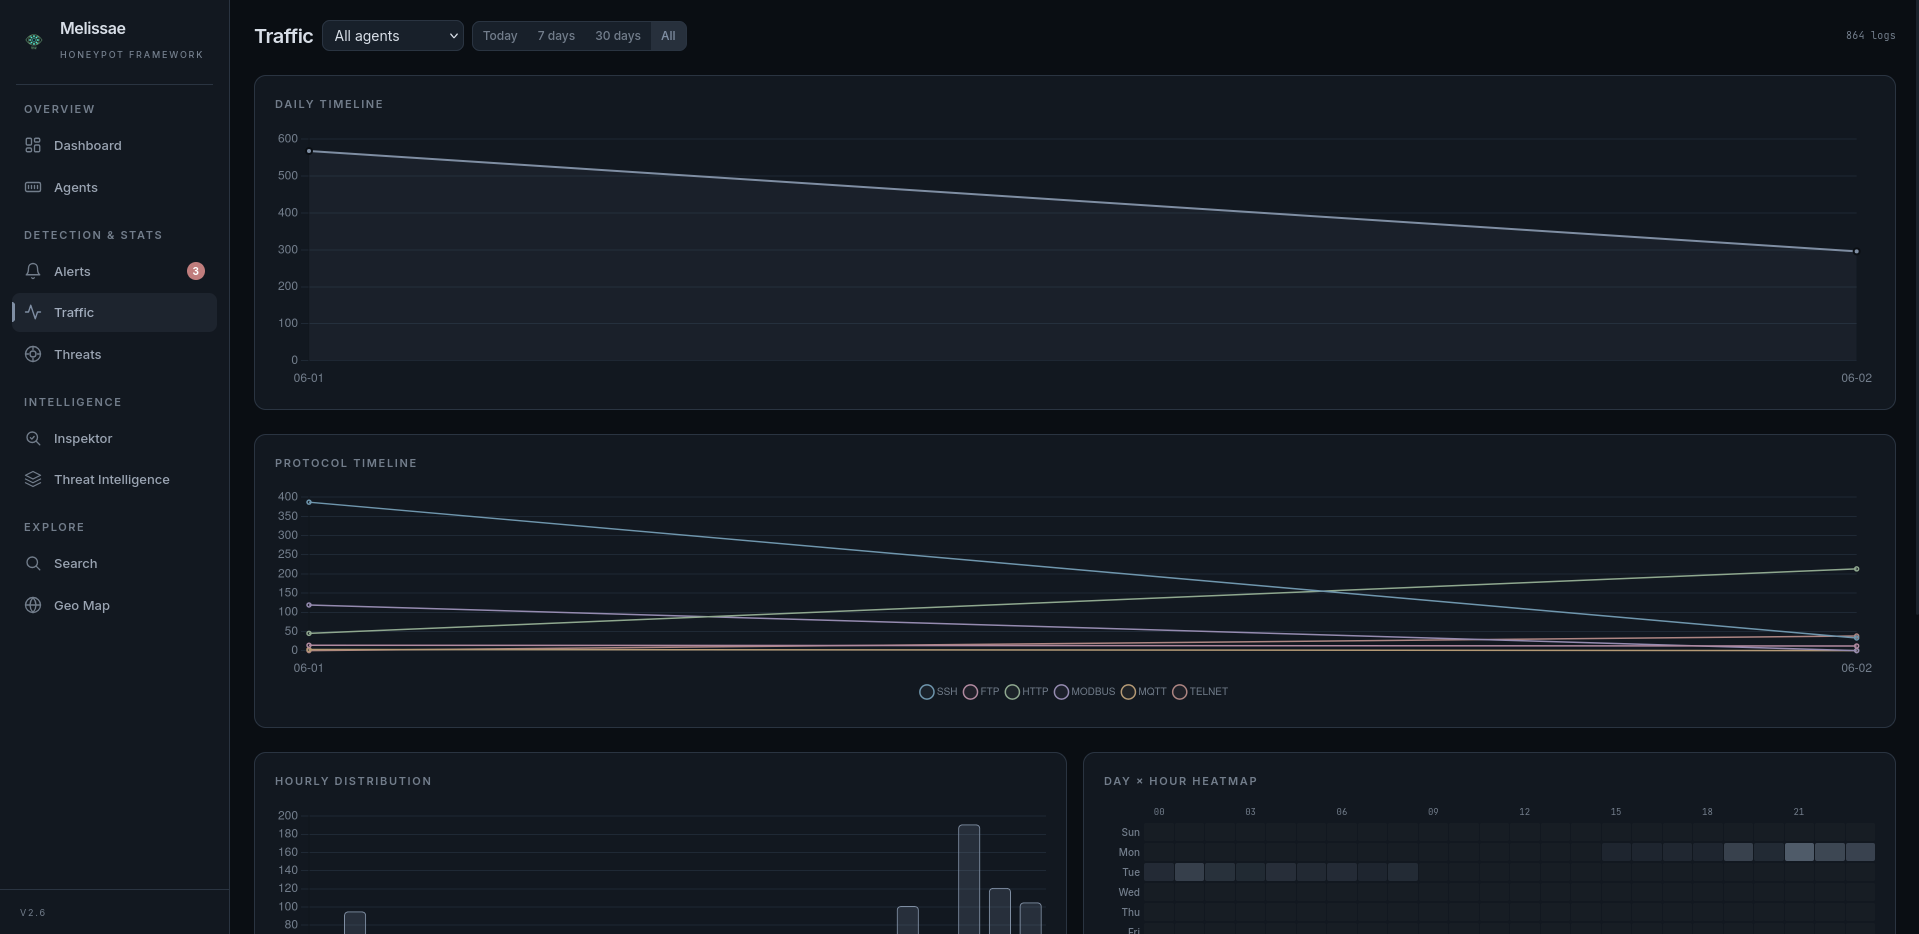

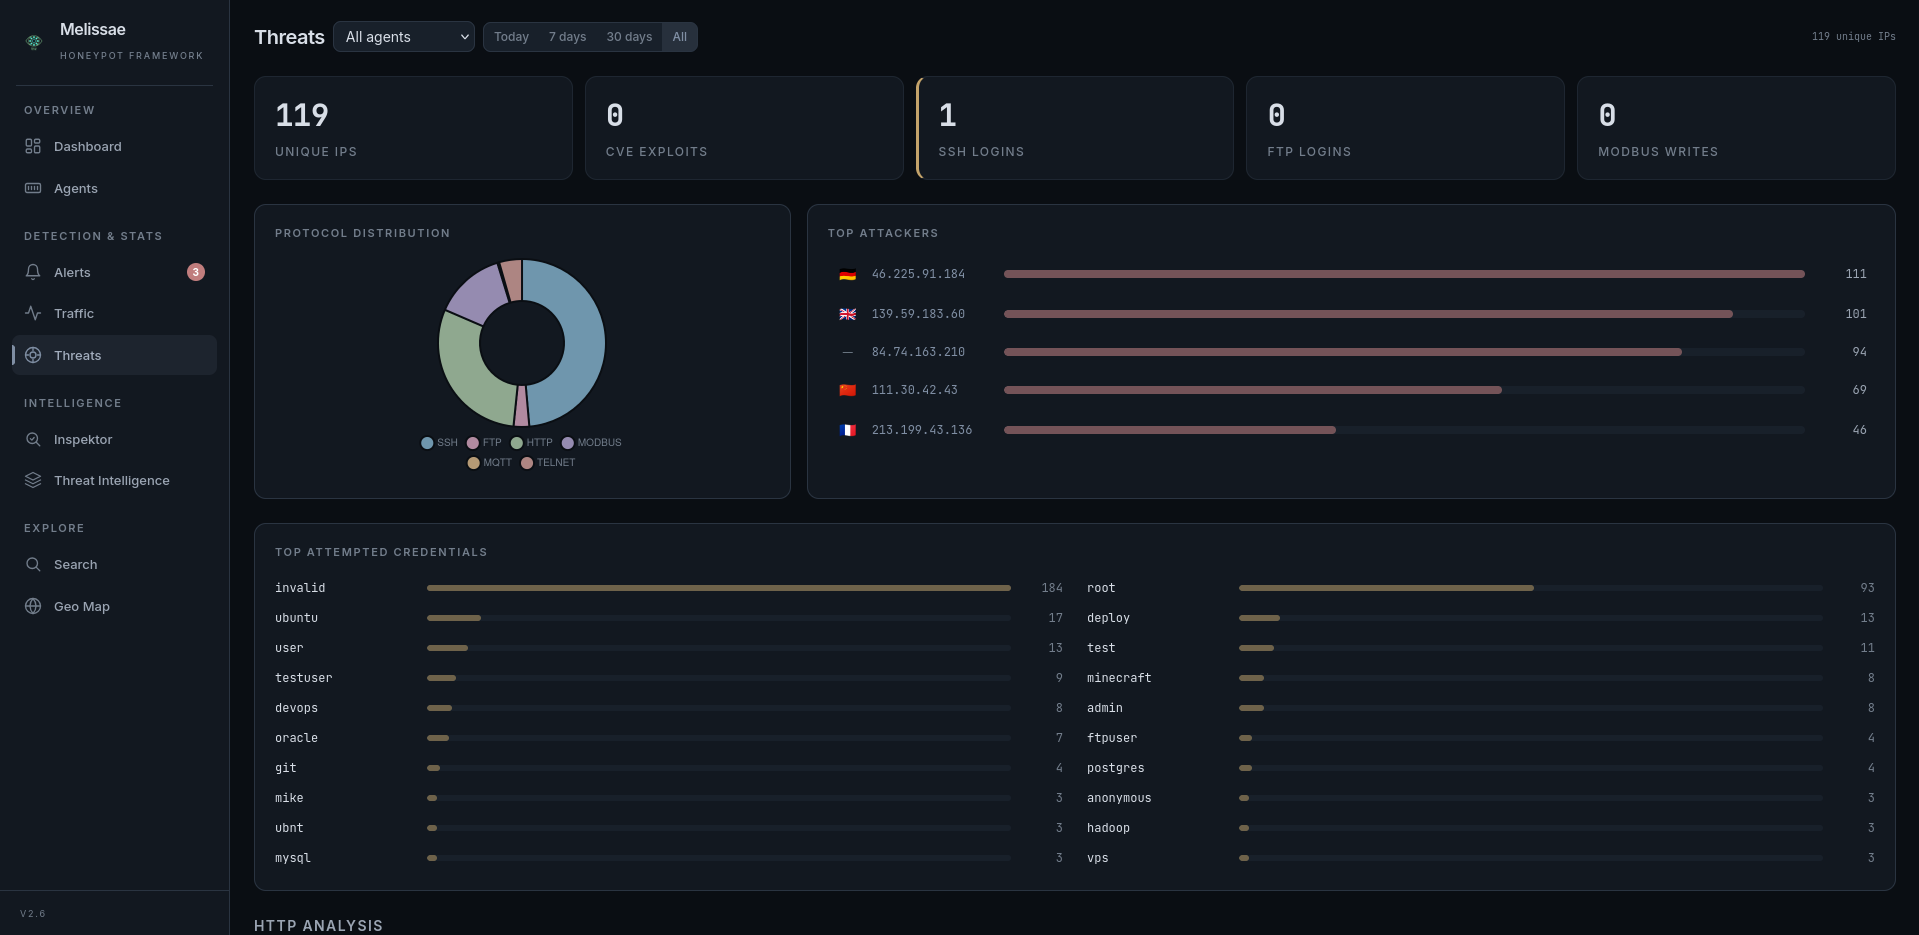
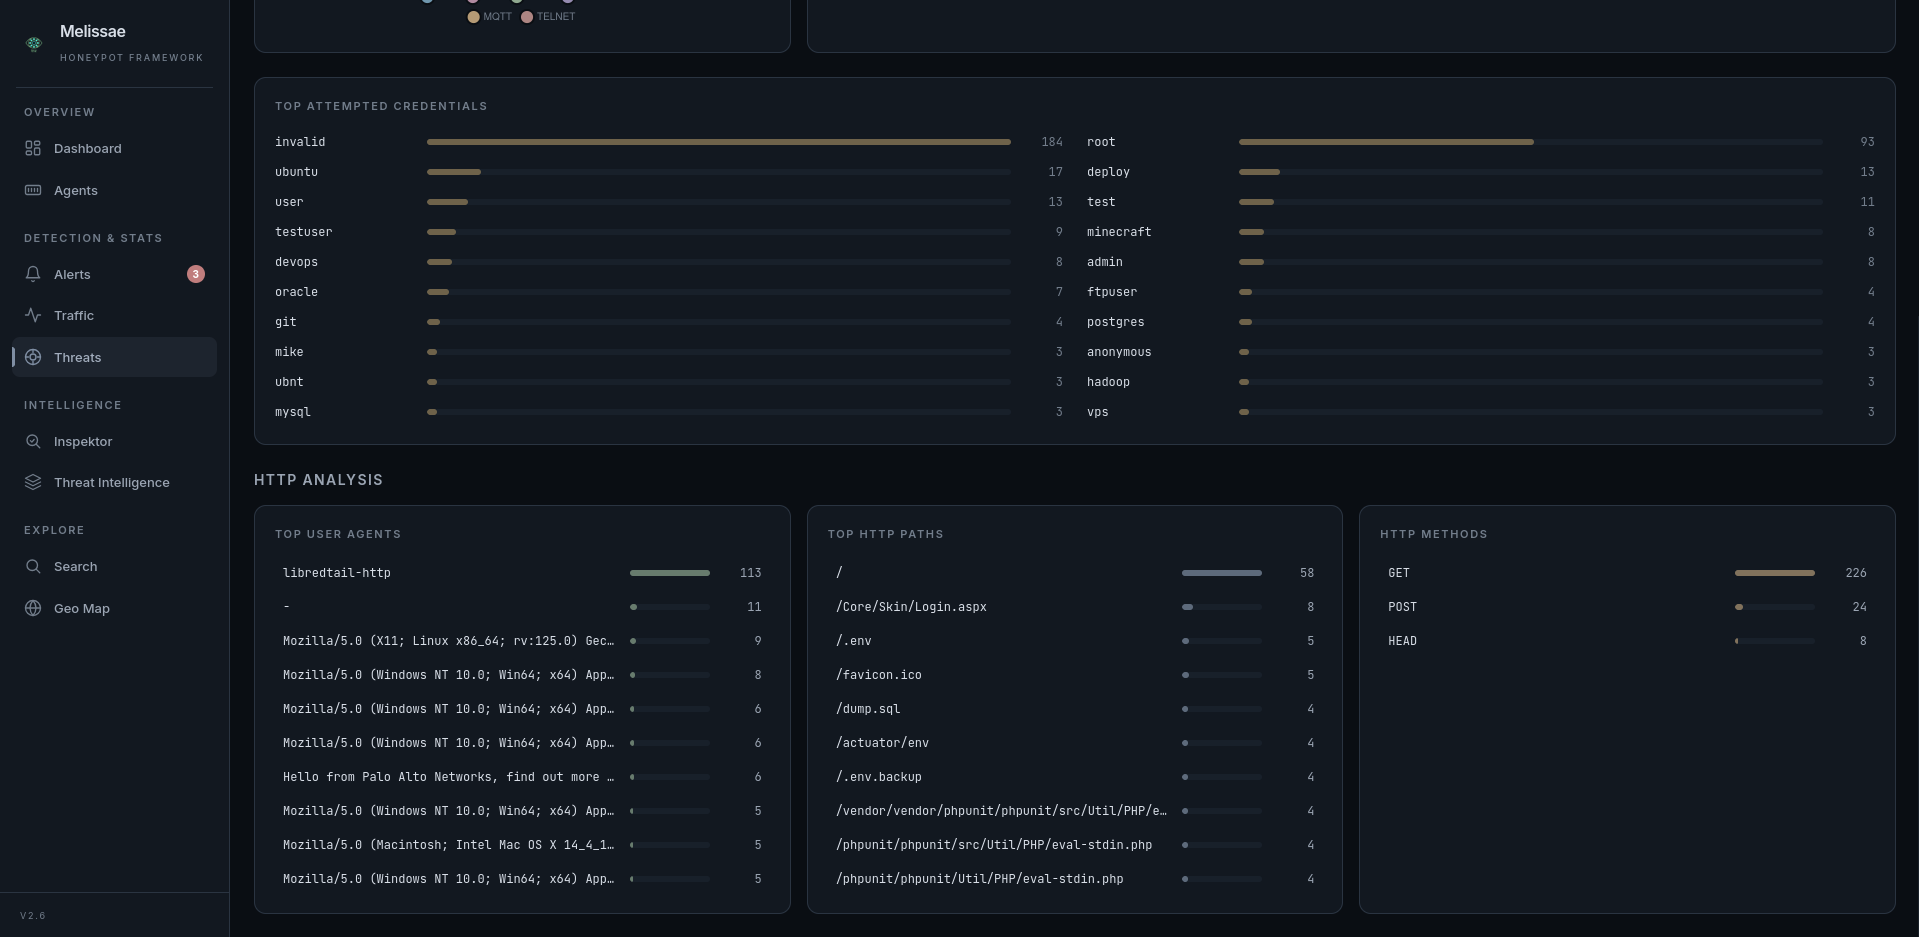
Two dedicated statistics pages complement the main dashboard:
/stats/activity— traffic patterns over time (volumes, protocol mix, hourly distribution, day×hour heatmap)./stats/attackers— per-attacker breakdowns (top IPs, top credentials, top user-agents, geo distribution).
Rules#
The API exposes the catalog of YAML rules at GET /api/rules together with last-run metadata (last_run_at, last_alerts_emitted, last_groups_triggered). The dashboard surfaces this catalog so reviewers can see at a glance which rules are enabled, their severity, MQL query, threshold and contribution to the score.